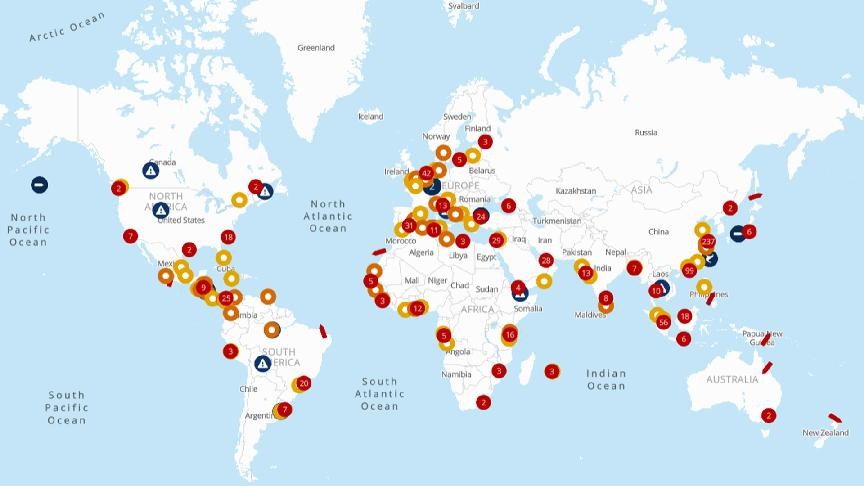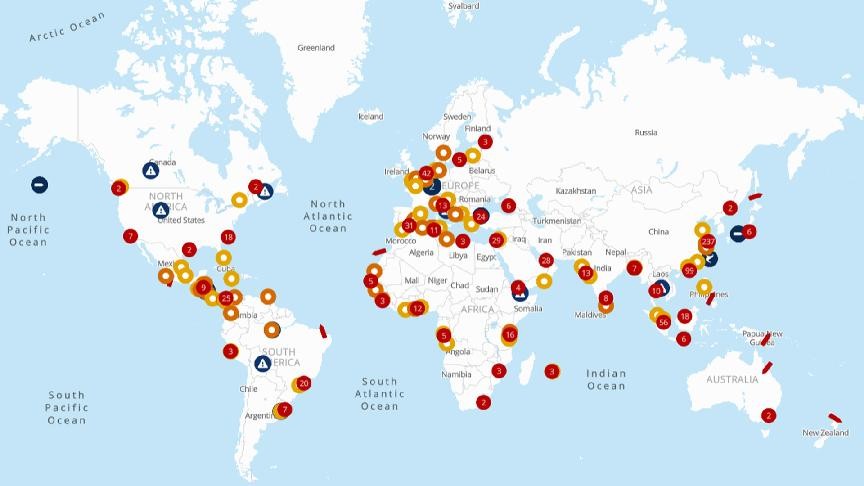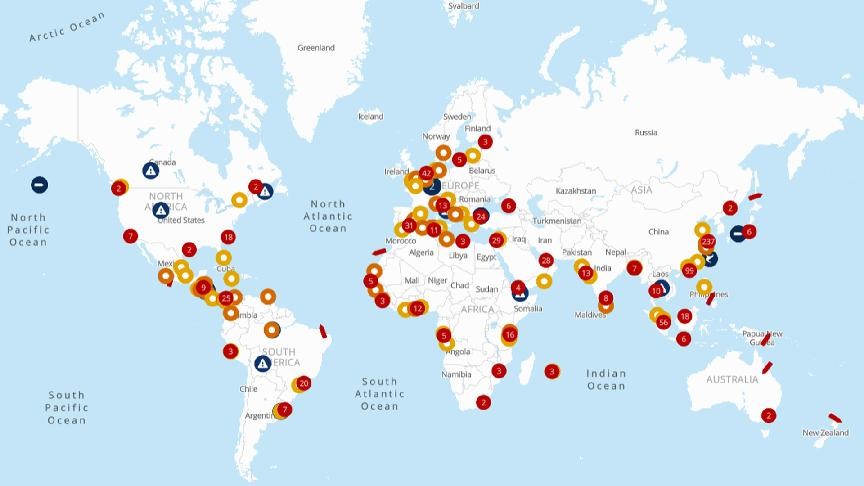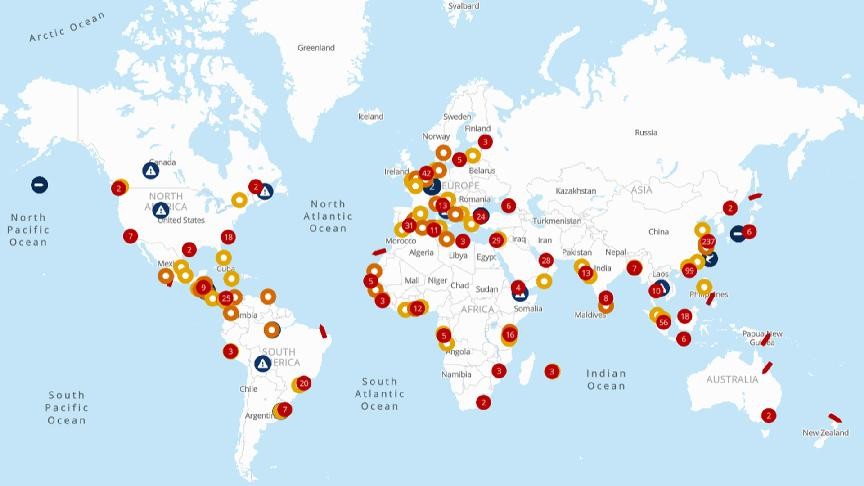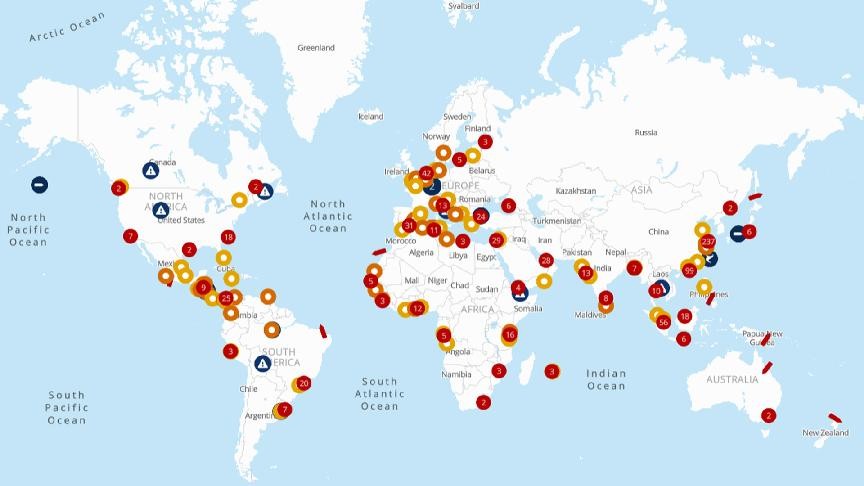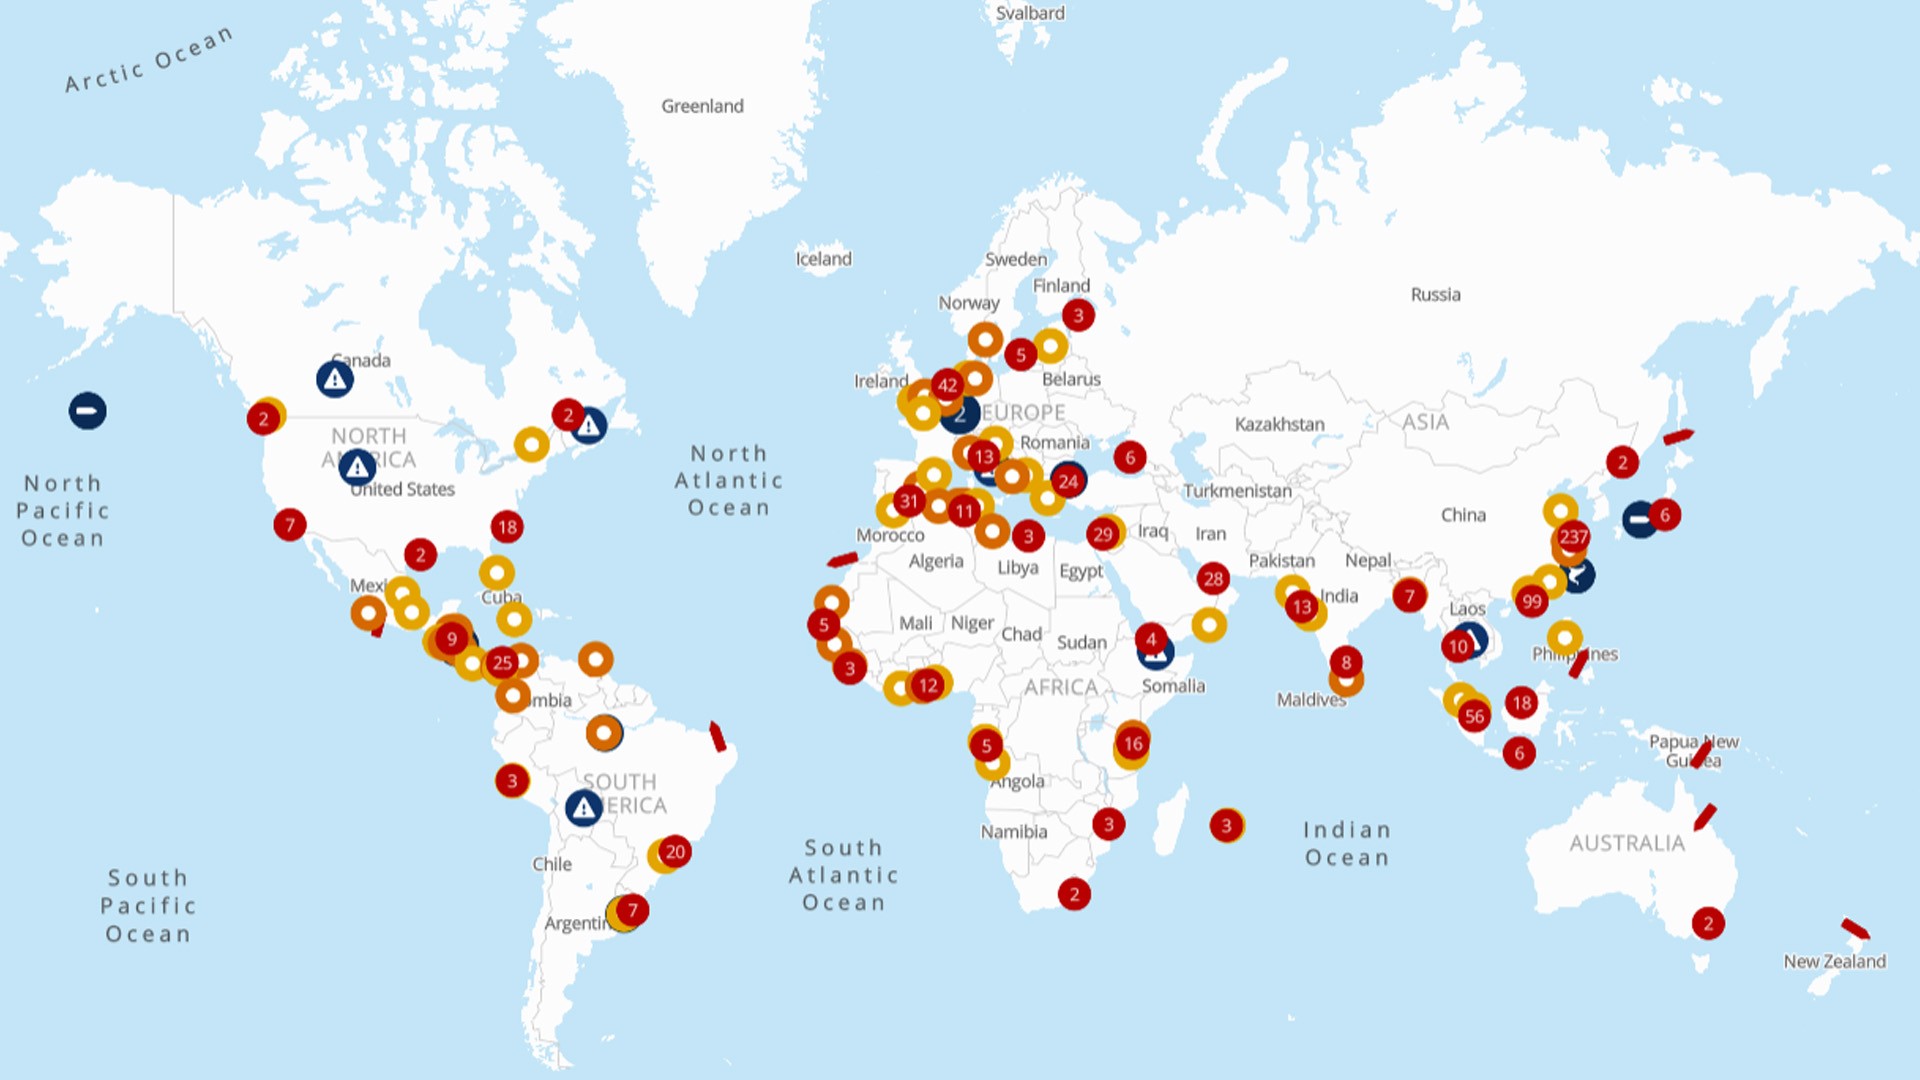

Stay ahead of supply chain disruptions and port congestion with Kuehne+Nagel’s weekly port operational update.
- Find out the latest vessel waiting times and status of ports in Africa, Asia, Oceania, Europe, the Middle East-Indian Subcontinent, North America, and South and Central America.
Africa
Mozambique
Beira: The 7-day average vessel waiting time is around 13.22 days. Terminal recovery is expected by Weeks 32–33.
South Africa
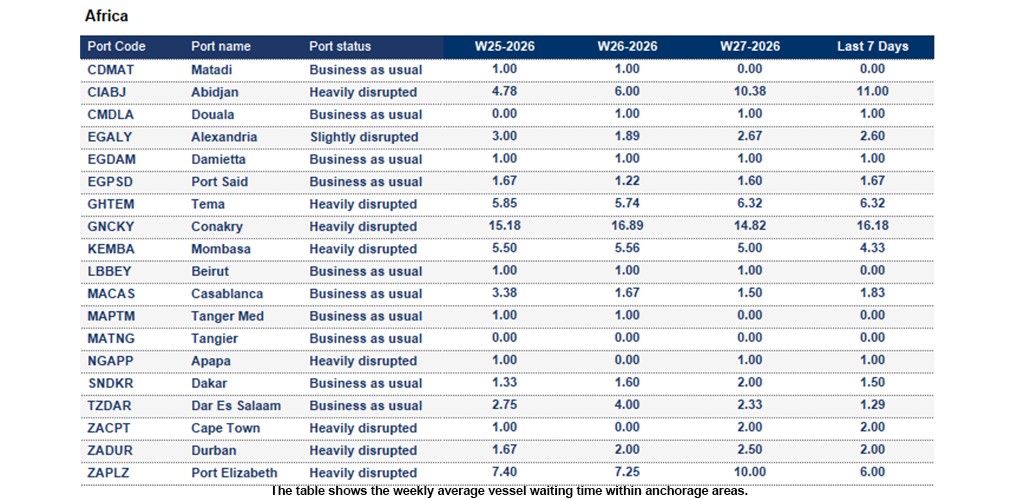
Cape Town: The 7-day average vessel waiting time is around 2.0 days. Exceptionally high reefer demand driven by overlapping citrus and deciduous export seasons is placing significant pressure on capacity. Increased late-stack volumes are further constraining operations. The port remains the most constrained in the network, with a high risk of delays and cargo rollings expected in the coming weeks.
Durban: The 7-day average vessel waiting time is around 2.0 days. Terminal operations remain operational but congested, with high reefer plug utilisation driven by peak citrus export volumes. Landside congestion and inconsistent truck turnaround times continue to impact efficiency, while operational pressure is expected to persist throughout the peak citrus season. However, Durban is currently experiencing heightened tensions and sporadic disruptions linked to anti-immigration protests.
Port Elizabeth: The 7-day average vessel waiting time is around 6.0 days. Coega is experiencing operational challenges due to seasonal tidal restrictions and backlogs resulting from recent adverse weather conditions, impacting terminal productivity and cargo flows. The terminal is experiencing ongoing crane breakdowns, reducing productivity to approximately 12 moves per hour. Reefer volumes remain elevated but manageable. While the terminal is helping relieve pressure from Cape Town export flows, this is impacting operations in Port Elizabeth and Coega. Backlogs are expected to persist for the next three months.
Asia Oceania
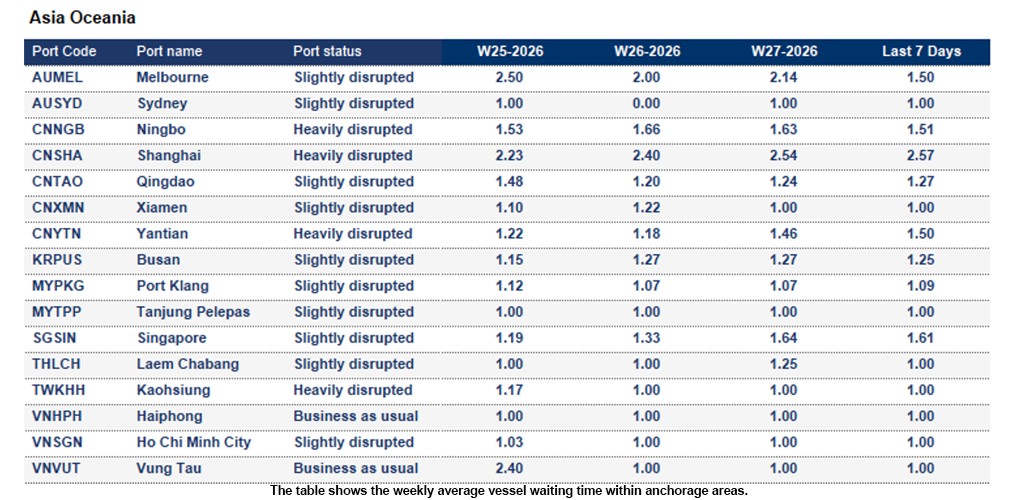
Typhoon Bavi is advancing across the western Pacific after crossing the Northern Mariana Islands and is forecast to move through the Philippine Sea, pass north of Taiwan and approach Fujian Province in China around 12 July, while weather alerts remain in place across the Northern Mariana Islands, the Philippines, Taiwan and southeastern China. In addition to the typhoon threat, China is experiencing severe weather impacts in Hubei, Guangxi, Jiangsu and Shandong, with forecasts of heavy rainfall, thunderstorms and possible tornadoes in some areas. Read more here.
China
Nansha: The 7-day average vessel waiting time is around 1.08 days. Minor berth congestion is being experienced at GOCT (Nansha Phase 2), with vessel waiting times and delays currently ranging between 0.5 and 1 day.
Ningbo: The 7-day average vessel waiting time is around 1.51 days. Typhoon No. 9 Bavi has formed over the northwest Pacific and is forecast to track toward the East China Sea, with a high risk of disruption from next week. At MSICT, waiting times have increased to around 2 days as elevated yard density continues to impact productivity, with congestion expected to persist for at least another week.
Shanghai: The 7-day average vessel waiting time is around 2.57 days. Typhoon No. 9 Bavi has formed over the northwest Pacific and is forecast to move towards the East China Sea, with significant disruption risk expected from the end of this week. At YGS12, average waiting times reached 6 days this week, driven by concentrated mainline vessel arrivals, increased cargo volumes, and longer port stays, resulting in severe berth congestion.
Yantian: The 7-day average vessel waiting time is around 1.5 days. Six quay cranes remain under heightening upgrades until August, reducing berth capacity with one berth unavailable. Heavy congestion persists, with vessel bunching driving waiting times of approximately 1.5–2 days.
Indonesia
Belawan, Sumatra: The 7-day average vessel waiting time is around 2.0 days. Berth congestion continues, with off-window vessels experiencing delays of approximately 1–1.5 days. Operational productivity remains impacted by ongoing RTG issues, contributing to slower cargo handling and extended vessel turnaround times.
Surabaya: The 7-day average vessel waiting time is around 1.25 days. The port remains congested, with vessel waiting times of around one day. Berth availability and operational flexibility continue to be impacted by the closure of a 200-metre quay section for the commissioning of new quay crane equipment. Berthing allocations are currently managed on a first-arrived, first-served basis according to vessel ETA.
Japan
Yokohama: The 7-day average vessel waiting time is around 1 day. Berth congestion remains, with vessel delays of approximately 1–1.5 days, mainly driven by concentrated vessel arrivals. In addition, Tropical Cyclones Mekkhala and Higos in the vicinity may disrupt port and vessel operations, posing a further risk to schedule reliability and terminal productivity.
Malaysia
Port Klang: The 7-day average vessel waiting time is around 1.09 days. In WSP, the situation remains good and healthy on the yard density (75-80%), productivity and waiting time in week 26. However, the situation could be worsened and complicated in week 28, with high calls/moves and vessel bunching anticipated.
New Zealand
Lyttelton: A powerful storm is affecting New Zealand’s South Island, with rare red heavy rain warnings issued for parts of Marlborough, Canterbury, Dunedin and Clutha due to the risk of severe flooding, landslides and dangerous river conditions. The weather conditions could lead to transport disruptions, and port-related landside operations may face challenges if road access, local infrastructure or workforce mobility are affected.
Taiwan
Kaohsiung: The 7-day average vessel waiting time is around 1 day. Capacity remains tight due to strong demand and overbookings. Booking challenges continue, and capacity availability is currently assessed as high risk.
Vietnam
Ho Chi Minh City: The 7-day average vessel waiting time is around 1 day. Yard congestion has stabilised, but utilisation remains high, with yard density at approximately 85–90%. While conditions are currently manageable, the terminal continues to operate under capacity pressure due to the elevated storage levels.
Europe
Belgium
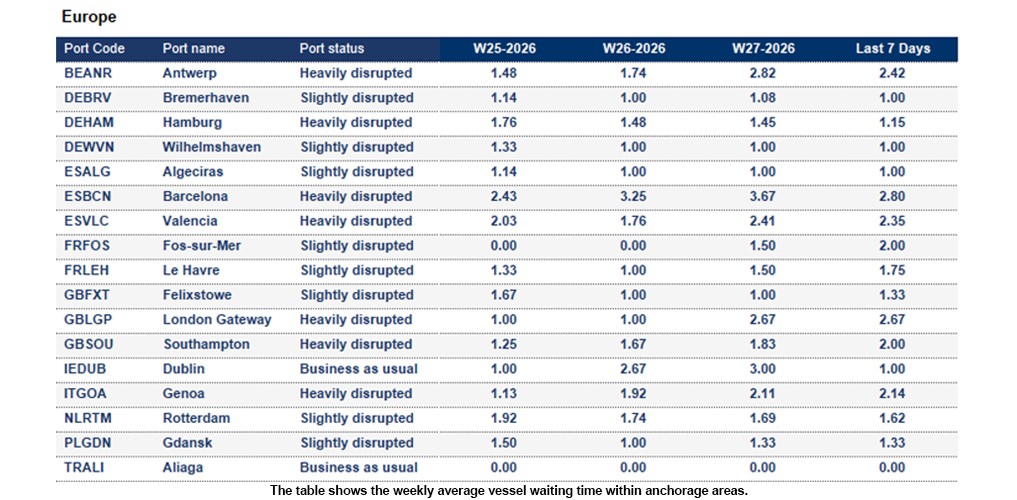
Antwerp: The 7-day average vessel waiting time is around 2.42 days. Pilot services have resumed; however, vessel backlogs continue to affect the lineup and are expected to persist through this week. Labour availability has also been reduced by the start of the school holiday period. At Antwerp Gateway, yard utilisation reached critical levels, forcing the terminal to suspend cargo deliveries. The disruption was triggered by the pilot strike, which restricted vessel movements and cargo evacuation.
France
Le Havre: The 7-day average vessel waiting time is around 1.75 days. Yard occupancy has increased to approximately 70%, while reefer plug availability has reached a critical level. The primary cause is repeated cut-and-run operations over consecutive weekends, resulting in a terminal backlog of nearly 700 containers. Vessel arrivals continue to be concentrated between Thursday and Saturday, placing sustained pressure on terminal operations.
Germany
Hamburg: The 7-day average vessel waiting time is around 1.15 days. There is currently a system outage at the ECT. Yard occupancy remains high at 82%, with delivery restrictions for IMO reefer containers in place and ongoing terminal congestion. The overall situation remains critical, requiring continued cargo diversions to help manage waiting times. Further operational restrictions are anticipated in Week 28 due to planned maintenance and construction activities, which are expected to create additional capacity and productivity challenges.
Wilhelmshaven: The 7-day average vessel waiting time is around 1 day. Yard density remains manageable at around 80%; however, overall operations continue to be under pressure due to limited labour availability. The upcoming holiday period is expected to place further strain on resources, while the absence of any operational buffer means that disruptions to vessel schedules, equipment availability or labour supply could result in immediate delays and congestion.
Portugal
Sines: The 7-day average vessel waiting time is around 2 days. The port is congested, and transhipment delays occur.
Middle East - Indian Subcontinent
Strait of Hormuz: Vessel traffic continues to recover as US–Iran talks are set to resume, although long-term stability remains uncertain. Container carriers are assessing voyages on a case-by-case basis, while Middle East ports continue to operate normally. Despite improving conditions, around 85 container vessels (180,000 TEU) remain held in the region, and operators continue to monitor security and political developments closely. Read more here.
Saudi Arabia
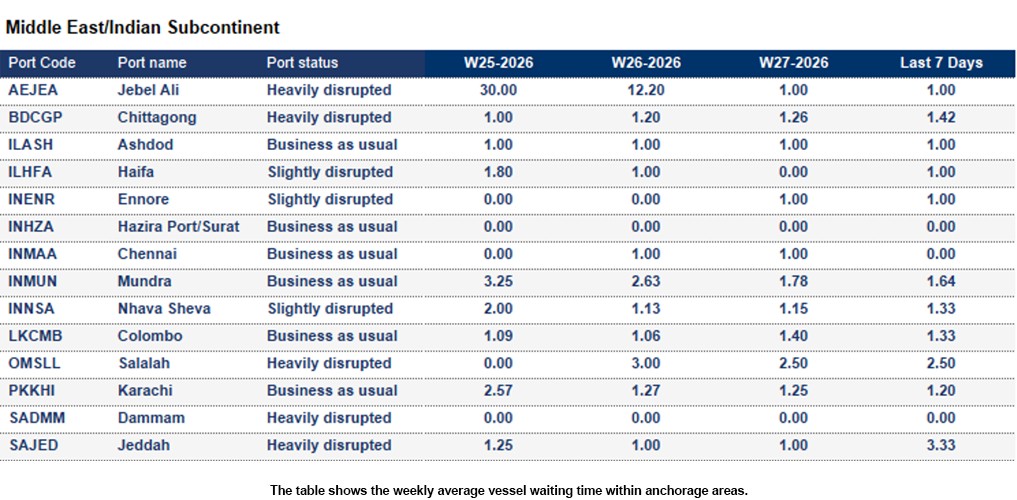
Jeddah Port: Severe congestion continues as cargo is diverted via Gulf land bridge routes, pushing yard utilisation to 90% and reducing productivity. Truck queues, extended container release times, and pressure across the logistics network are causing significant delays. Most carriers have suspended bookings for in-transit cargo via Jeddah, while some are diverting shipments through alternative ports such as King Abdullah Port, Djibouti, and Mundra to alleviate congestion. Read more.
Bangladesh
Chittagong (Chattogram): The 7-day average vessel waiting time is around 1.42 days. Flooding and heavy rainfall continue to disrupt operations, impacting container yards, cargo handling, and CFS activity. Labour shortages and restricted mobility are causing delays in receiving, loading, and unloading cargo, resulting in longer dwell times. Read more.
North America
Canada
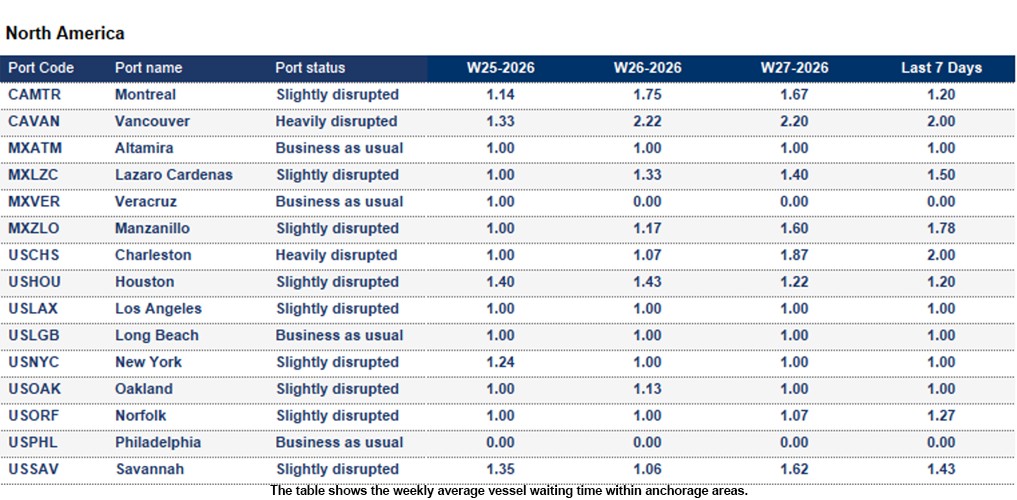
Average import rail dwell time for Canadian cargo (Vessel arrival to departure rail ramp):
- Halifax: 3 days
- Montreal: 7 days
- Prince Rupert: 5 days
- Saint John: 6 days
- Vancouver: 6 days
United States
Average import rail dwell and transit time for US cargo (Vessel arrival to departure rail ramp):
- Halifax- 13 days
- Montreal- 7 days
- Prince Rupert- 7 days
- Vancouver- 6 days
- Saint-John- 7 days
- Charleston- 2 days
- Newark- 3 days
- Houston- 8 days
- Wilmington- 2 days
- Los Angeles- 5 days
- Long Beach- 6 days
- New York- 4 days
- Miami- 1 day
- Oakland- 6 days
- Norfolk- 2 days
- Philadelphia- 10 days
- Savannah- 2 days
- Seattle- 5 days
- Tacoma- 4 days
South and Central America
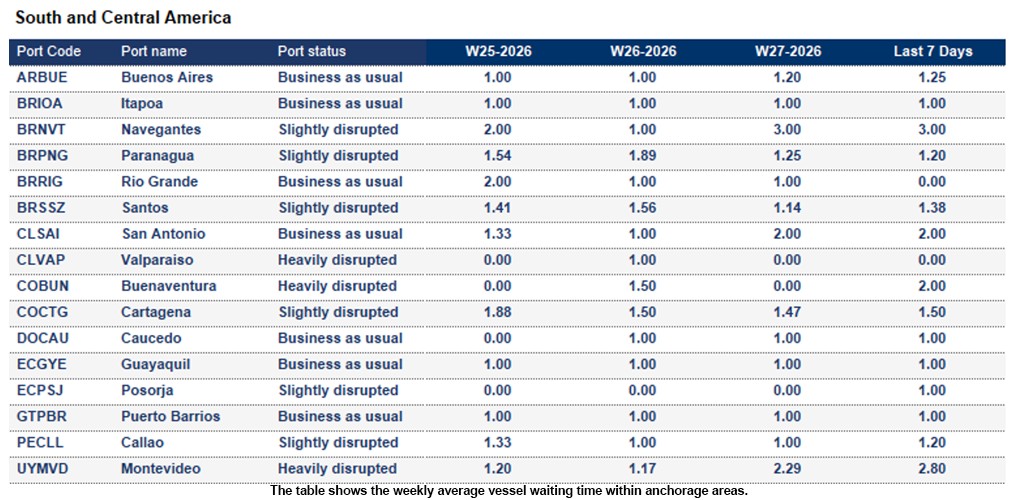
Chile
Heavy swell conditions continue to restrict operations at Arica, Iquique, Puerto Angamos, Antofagasta, Coquimbo, and Valparaíso (TPS/TPV). Vessel movements and cargo handling remain impacted, with delays and reduced productivity persisting. Further disruptions are possible until sea conditions improve.
Panama:
The Panama Canal Authority will further reduce the maximum authorised draft for Neopanamax vessels to 14.94m (49.0 ft) TFW from 24 July and 14.78m (48.5 ft) TFW from 15 August as part of water conservation measures amid potential El Niño conditions. In addition, maintenance at Gatun Locks on 21–22 July will reduce available Panamax transit slots and may cause minor delays. Read more here.
Uruguay
Montevideo: The 7-day average vessel waiting time is around 2.8 days. Terminal Cuenca del Plata (TCP), which handles approximately 80% of Uruguay’s foreign trade, is facing an ongoing labour dispute over working conditions, wages and automation. Recurring industrial action resulted in a partial port shutdown on 29 June, disrupting terminal operations and increasing the risk of delays. Further operational impacts remain possible while negotiations continue.
Venezuela
La Guaira: Operations are suspended due to the recent earthquake.
Puerto Cabello: The 7-day average vessel waiting time is around 1.67 days. Port operations remain fully operational with minimal impact from the recent earthquake. As the country’s principal commercial gateway and a key entry point for humanitarian cargo, the port continues to handle containerised, breakbulk and relief shipments. Moderate congestion is expected, with priority potentially given to government and humanitarian cargo, which could result in increased dwell times and some delays due to overall system pressure.
How Kuehne+Nagel estimates port disruption statuses
Seaexplorer has four port statuses that are estimated based mainly on the 7-day average vessel waiting time. Other factors include yard congestion, labour strikes, natural disasters or intermodal disruptions. Slightly different rules are applied to major ports, or ports that are hubs in their region, as they are typically more efficient.
- Business as usual means the port is currently operating without any significant disruption.
- Slightly disrupted is used if the 7-day average vessel waiting time exceeds 2 days.
- Heavily disrupted if the 7-day average vessel waiting time exceeds 4 days.
- Port closure is used when the port suspends operations due to a major disruptive event.
How Kuehne+Nagel calculates the 7-day average vessel waiting time
Mainline container vessels may spend a certain number of days waiting at designated anchorage areas before their scheduled port call.
To calculate the 7-day average waiting time, we consider the waiting days of these vessels, excluding:
- Waiting times for feeder vessels,
- Idle ships without an announced next port,
- Slow steamers heading toward the anchorage, but not actively waiting within the designated area
- Vessels passing through the anchorage area without intending to call at the port.
This rolling average is based on the last 7 days of data and is updated daily in seaexplorer. To find the latest waiting time for a port, enter the port name or code in the search bar and select the relevant option.
Stay Ahead, Stay Informed: Register for seaexplorer for the latest disruptions and vessel waiting times at global container ports.