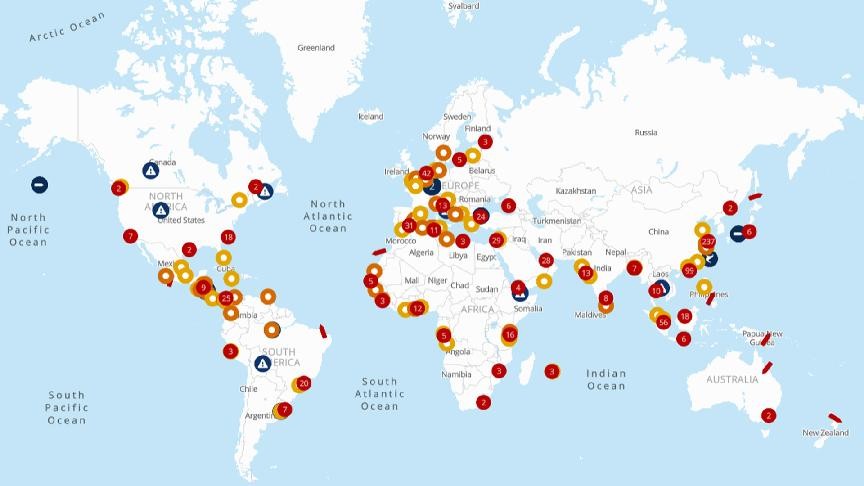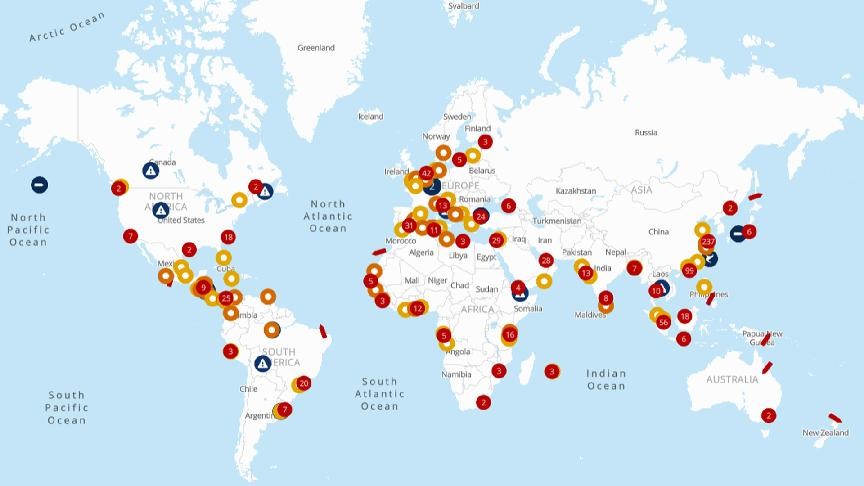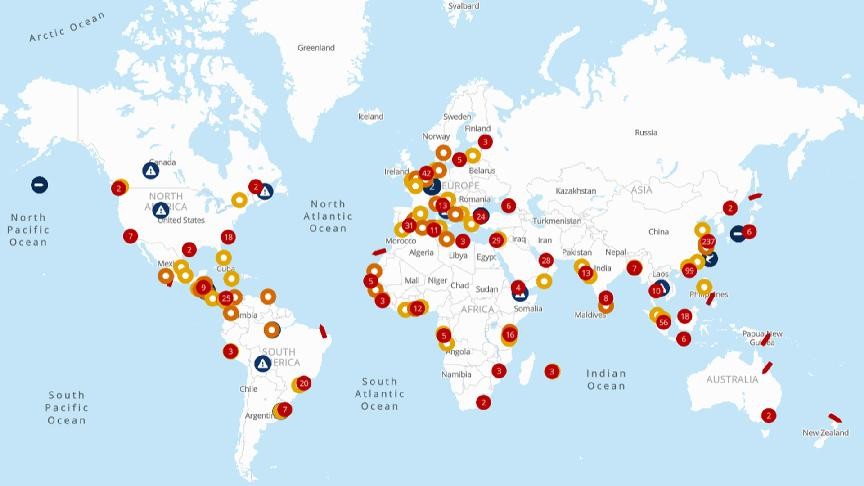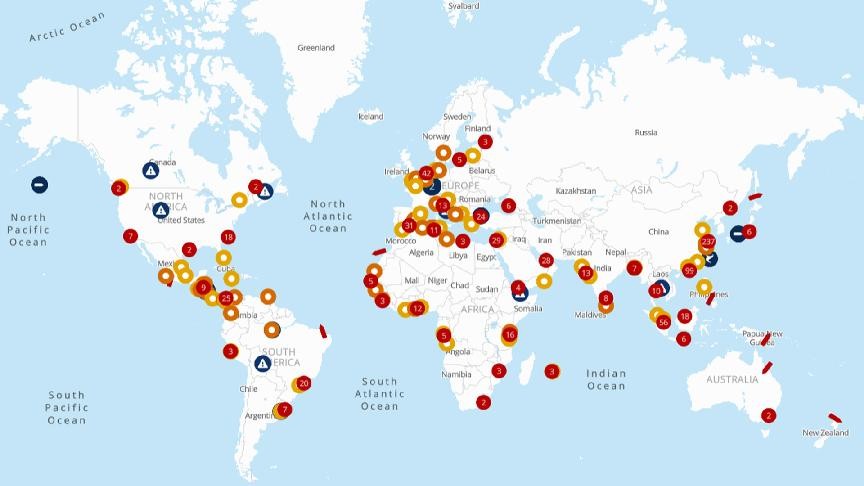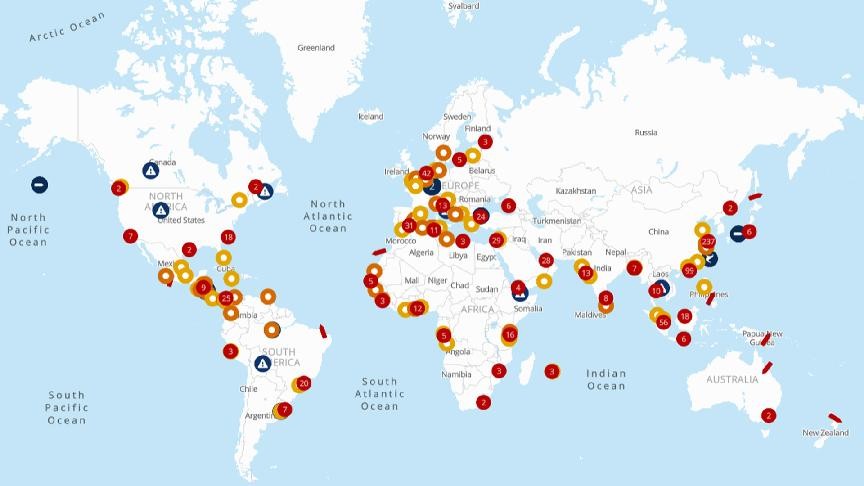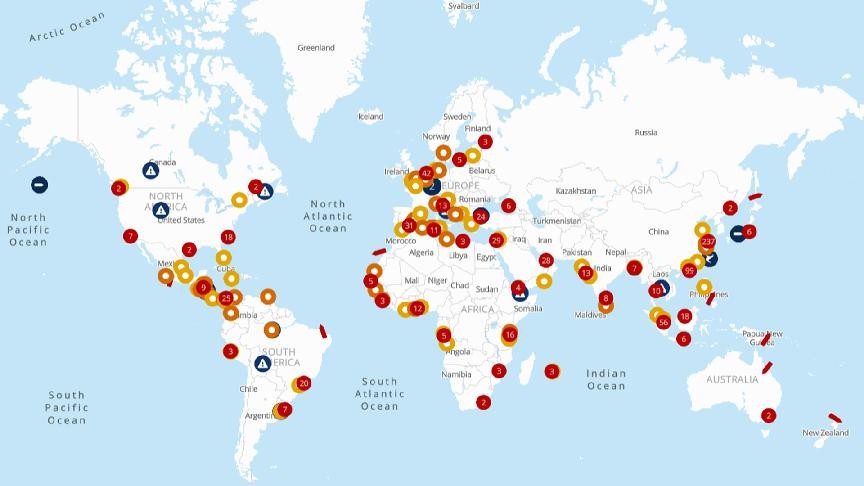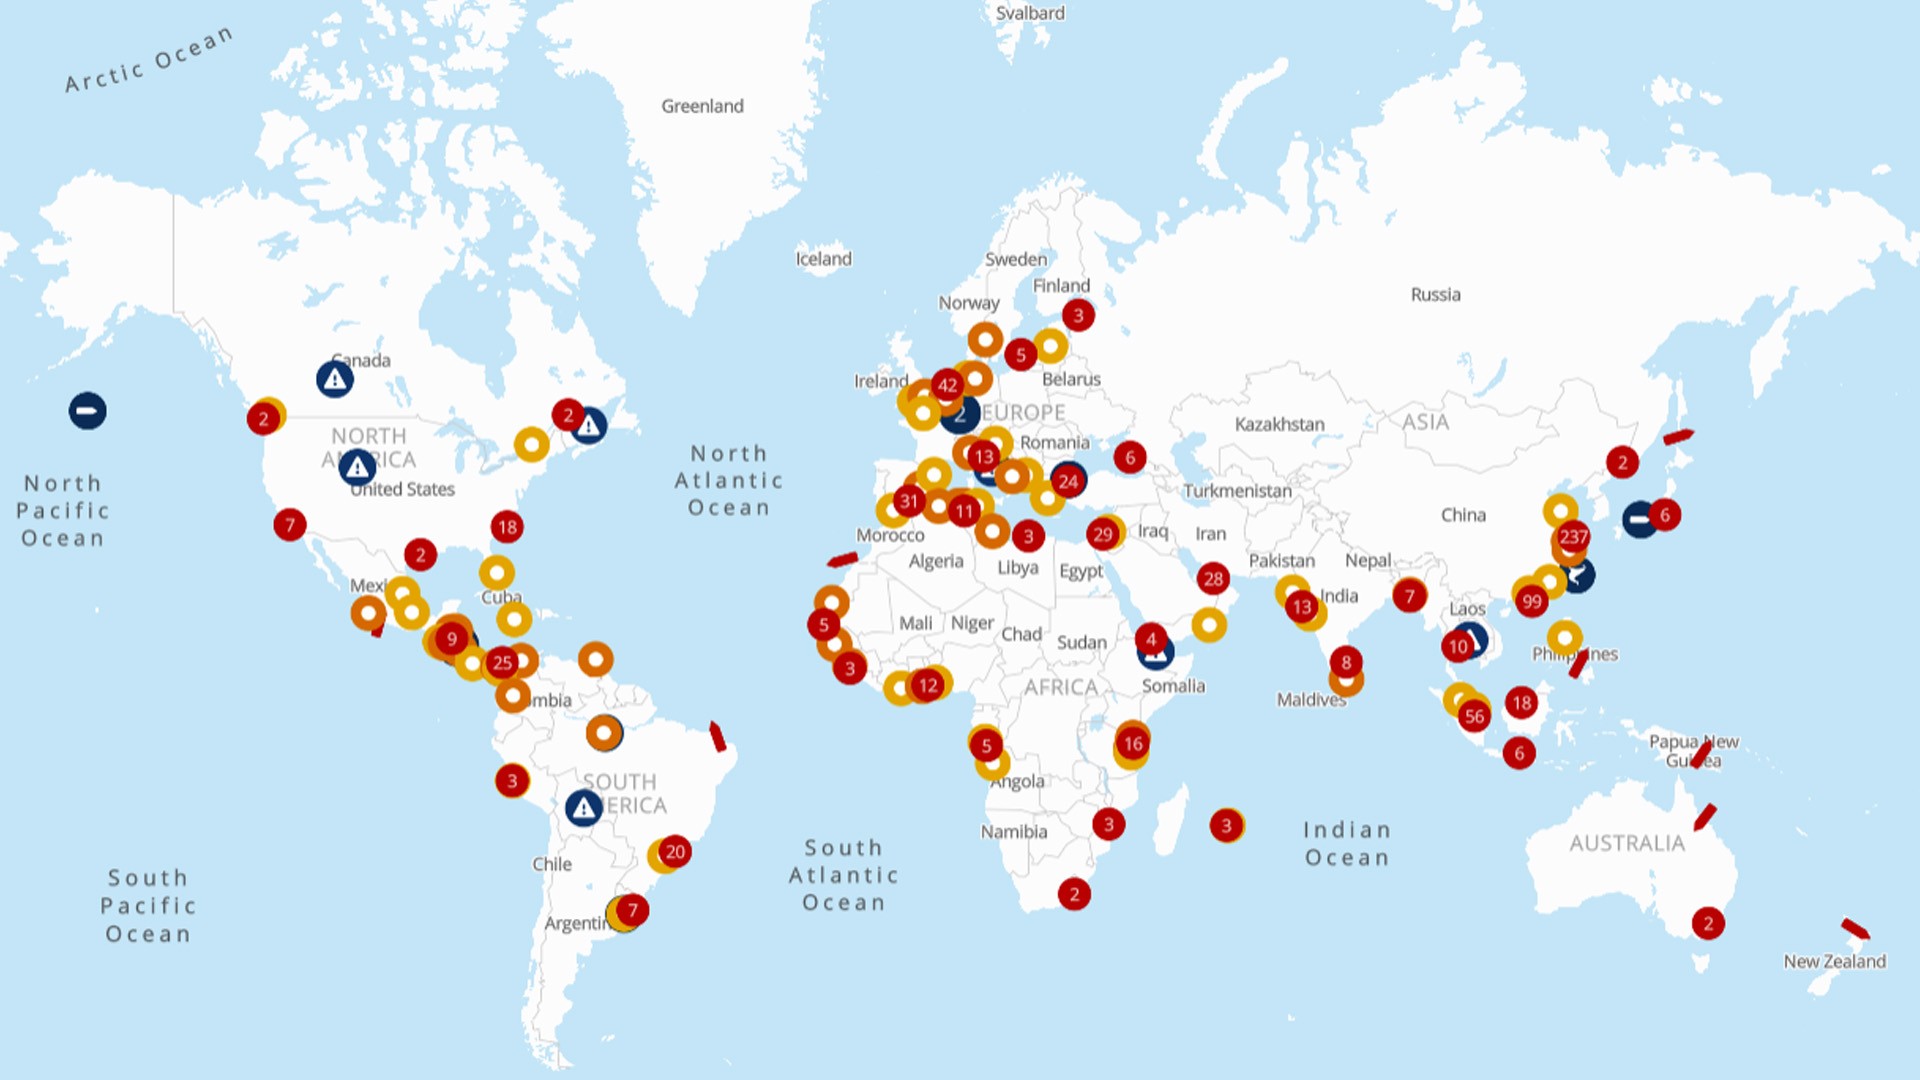

Stay ahead of supply chain disruptions and port congestion with Kuehne+Nagel’s weekly port operational update.
- Find out the latest vessel waiting times and status of ports in Africa, Asia, Oceania, Europe, the Middle East-Indian Subcontinent, North America, and South and Central America.
Africa
Cameroon
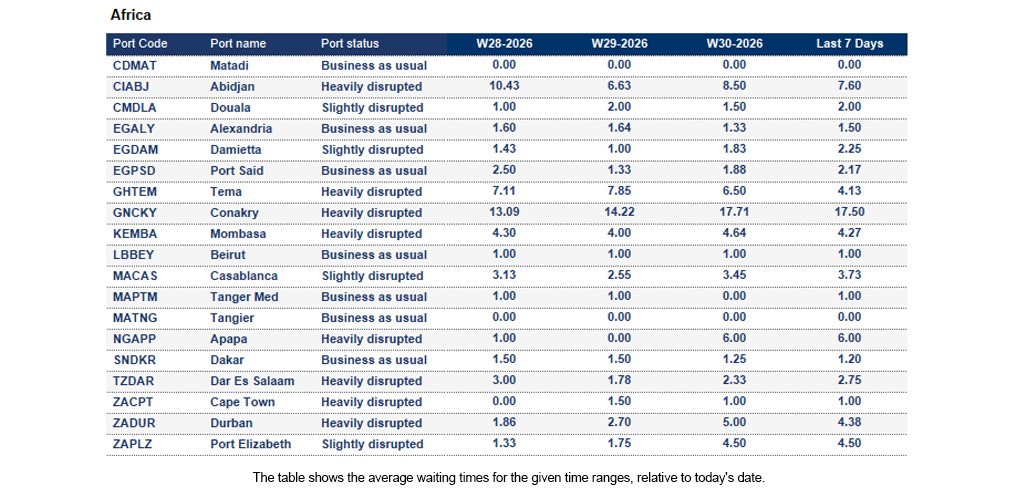
Douala: The 7-day average vessel waiting time is around 2.0 days. The port is slightly congested. The rainy season and deteriorating road conditions continue to impact inland transportation. In addition, the 28-metric-ton truck and container weight restriction remains in effect.
Ghana
Tema: The 7-day average vessel waiting time is around 4.13 days. Heavy rainfall and flooding, which peaked on 28–29 June, continue to affect transport corridors and truck access to the port. High cargo volumes continue to place pressure on berth and yard capacity, contributing to elevated congestion. Increased terminal activity may impact vessel turnaround times, yard utilisation, and overall operational efficiency.
Mozambique
Beira: The 7-day average vessel waiting time is around 15.71 days. Terminal recovery is currently expected between Weeks 40 and 43. In the meantime, intermittent strong winds and rainfall are forecast throughout the week and may continue to affect operational efficiency and cargo movements.
Nigeria
Apapa: The 7-day average vessel waiting time is around 6.0 days. Significant congestion continues, with vessels experiencing extended anchorage times. Landside evacuation constraints, truck congestion, and Customs delays are impacting terminal productivity and contributing to ongoing cargo handling delays.
Tanzania
Dar Es Salaam: The 7-day average vessel waiting time is around 2.75 days. Vessel waiting queues continue as cargo volume growth outpaces berth capacity. Increased vessel calls and stronger carrier connectivity are driving higher throughput, placing additional pressure on port operations despite improved terminal performance.
Asia Oceania
China
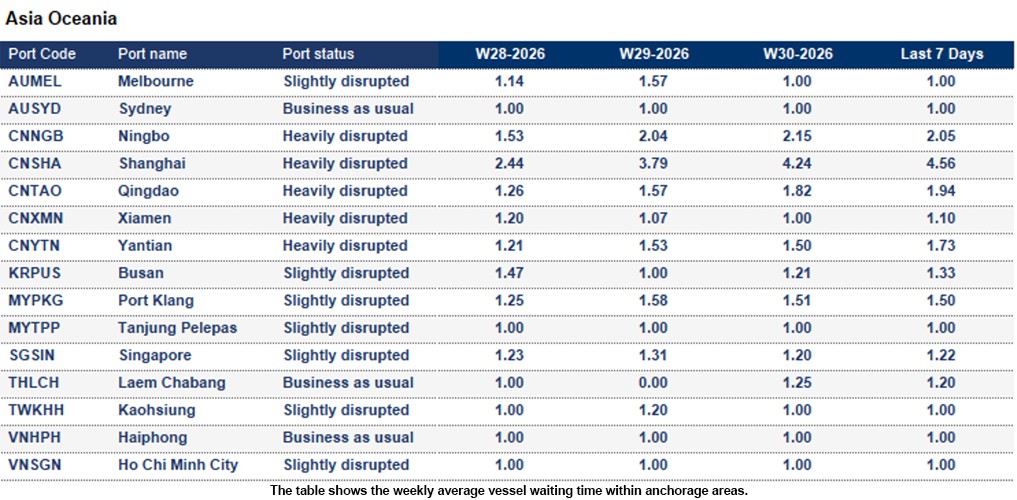
Operations at Yantian and Shekou have resumed following Typhoon Noul, but congestion remains high. Limited terminal appointments, yard pressure, road congestion and container yard backlogs are causing delays, increased costs and a higher risk of cargo missing vessel cut-offs. Read more here
Hong Kong:
Hong Kong: The 7-day average vessel waiting time is around 1.07 days. Although not reporting major port disruptions, Typhoon Noul brought strong winds and heavy rainfall across the region, causing broader transport disruptions and schedule adjustments. Operational conditions have improved as the storm weakened, but some residual delays may continue across regional supply chains.
Indonesia
Belawan, Sumatra: The 7-day average vessel waiting time is around 2.0 days. Berth congestion continues, with off-window vessels generally experiencing waiting times and delays of 1–2 days. Operational pressure remains manageable but requires continued monitoring.
Jakarta: The 7-day average vessel waiting time is around 1.86 days. Berth conditions remain challenging, with average waiting times of 1.5–2 days. A new quay crane is expected to be delivered to JICT on 1 August, and one berth will be blocked for 7–10 days during crane commissioning.
Semarang: The 7-day average vessel waiting time is around 1.13 days. Berth congestion continues, with average delays of 1–2 days. Yard density remains around 80%, adding pressure to terminal operations and cargo flows.
Japan
Tokyo: The 7-day average vessel waiting time is around 1 day. Due to crane rail repair works from 21–28 July, Aomi Terminal will be limited to operating with only one quay crane. The reduced handling capacity is expected to impact vessel productivity and result in longer port stays for the JTX service during the maintenance period.
Malaysia
Port Klang: The 7-day average vessel waiting time is around 1.5 days. At WSP, yard density remains at 80–85%, with average delays of around 1.5 days. Maintenance dredging at berths 23–24 has been postponed to 3–12 August to help ease congestion.
Tanjung Pelepas: The 7-day average vessel waiting time is around 1 day. Minor berth congestion is being reported, with waiting times and delays of around 0.5 days in Week 30. Operations remain broadly stable.
Singapore
Singapore: The 7-day average vessel waiting time is around 1.22 days. Yard utilisation remains relatively high at around 80%, requiring continued monitoring of terminal capacity.
Vietnam
Ho Chi Minh City: Yard congestion remains high, with utilisation above 80% in Week 30.
Vung Tau: Berth congestion continues due to high call volumes across all lines, with waiting times of around 1–1.5 days in Week 30. Yard density remains high at above 90%, adding pressure to terminal capacity.
Europe
Wildfires in Spain and southwestern France continue to disrupt road and rail transport, causing evacuations, mobility restrictions and transport delays. No impacts on Spanish port operations have been reported so far. With high temperatures expected to continue and no rainfall forecast, disruption risks remain elevated across affected transport corridors. Read more here
Belgium
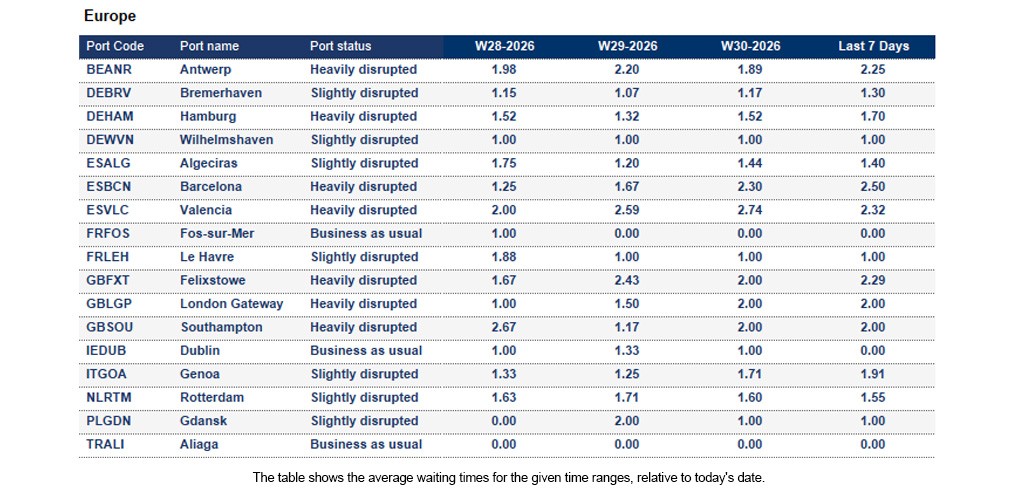
Antwerp: The 7-day average vessel waiting time is around 2.25 days. Operations remain stable, with yard occupancy at 62% (Q869) and 86% (Q913). Berth repairs and crane maintenance at Q913 from 27–30 July may affect capacity. Summer holidays and pilot shortages continue to impact vessel movements and schedule reliability.
Le Havre: The 7-day average vessel waiting time is around 1 day. Yard occupancy is approximately 50%, though reefer utilisation remains elevated. Shuttle delays linked to Antwerp continue to affect vessel schedules, while summer holidays may place pressure on gang availability through early September.
Germany
Low water levels on the Rhine and Danube continue to disrupt inland shipping, reducing vessel capacity and causing cargo delays. Ongoing drought conditions remain a risk to European supply chains despite some forecast rainfall. Read more here
Bremerhaven: The 7-day average vessel waiting time is around 1.3 days. Yard occupancy is nearing 95%, creating capacity constraints, particularly for IMO and OOG cargo. The NTB holiday period may affect operations, while accelerated container pickups are encouraged to ease congestion.
Hamburg: The 7-day average vessel waiting time is around 1.7 days. At CTA, congestion, labour shortages and planned crane maintenance are impacting operations. At CTH, operations remain stable with sufficient capacity to absorb delayed vessel arrivals.
Wilhelmshaven: The 7-day average vessel waiting time is around 1 day. Yard utilisation remains healthy at 70%, but delayed vessel arrivals continue to affect schedules. With no buffer in the vessel lineup, operational disruptions could quickly lead to delays.
Algeciras: The 7-day average vessel waiting time is around 1.4 days. Port congestion and transhipment delays continue to affect operations.
Barcelona: The 7-day average vessel waiting time is around 2.5 days. Yard capacity remains under pressure due to seasonal volumes and inland trucking constraints. Heatwaves, wildfires, and the planned rail service suspension from 2–8 August may further impact cargo flows.
Felixstowe: The 7-day average vessel waiting time is around 2.29 days. Productivity remains below target due to autonomous truck performance issues, contributing to congestion and vessel delays of up to 48 hours.
London Gateway: The 7-day average vessel waiting time is around 2.0 days. Operations remain stable, with sufficient yard capacity and container evacuation. QC5 remains out of service, and Berth 4 dredging may result in minor vessel constraints through 31 July.
Middle East - Indian Subcontinent
Middle East
Maritime security risks in the Gulf and Red Sea remain elevated as regional tensions, Houthi threats and subdued Strait of Hormuz traffic continue to shape vessel movements, while some major carriers have resumed selected Suez Canal routings despite ongoing uncertainty around Bab el-Mandeb and the wider operating environment. Read more
Pakistan
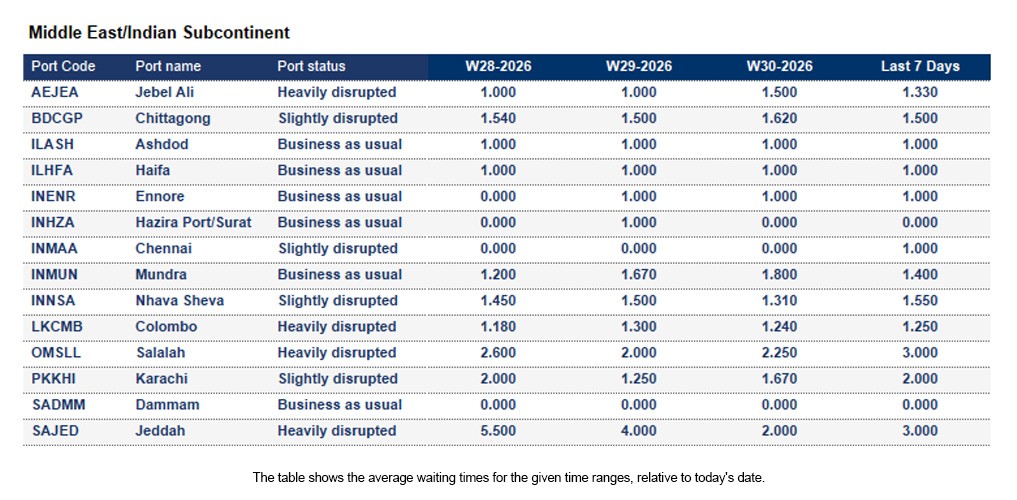
Karachi: The 7-day average vessel waiting time is around 2.0 days. Regional security and geopolitical tensions may negatively impact supply chain confidence, with the potential for disruptions to cargo flows, trade routes, and overall logistics stability.
Sri Lanka
Colombo: The
7-day average vessel waiting time is around 1.25 days. High congestion continues due to Middle East cargo diversions, with elevated yard occupancy and inter-terminal transfer delays impacting productivity. Some carriers have adjusted terminal allocations to help manage ongoing capacity constraints.
North America
Canada
Average import rail dwell time for Canadian cargo (Vessel arrival to departure rail ramp):
- Halifax: 3 days
- Montreal: 7 days
- Prince Rupert: 6 days
- Saint John: 8 days
- Vancouver: 7 days
Mexico:
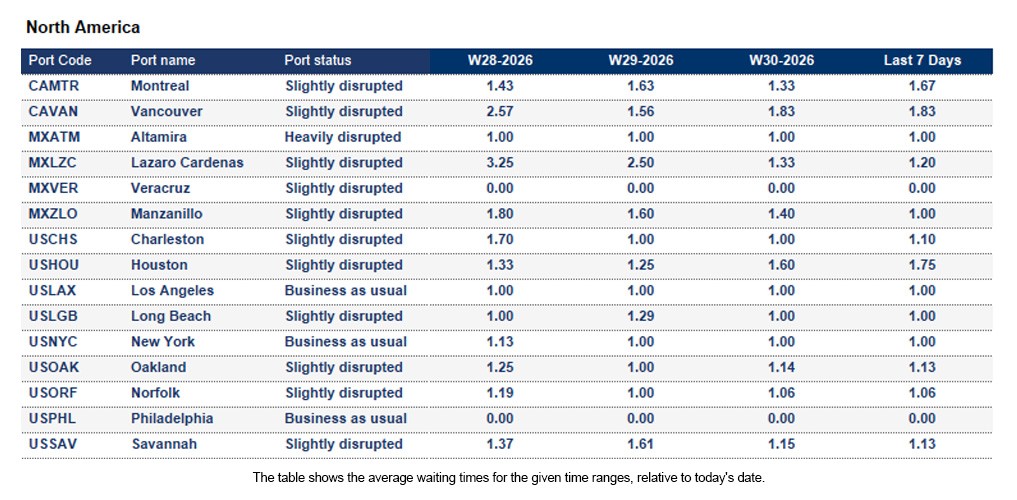
Altamira: The 7-day average vessel waiting time is around 1 day. Port congestion and operational delays continue to impact vessel schedules and cargo flows.
Lázaro Cárdenas: The 7-day average vessel waiting time is around 1.2 days. The APM terminal is operating with 83% yard occupancy, while berth congestion continues to affect operations.
Manzanillo: The 7-day average vessel waiting time is around 1 day. Operations remain stable, but high yard utilisation, customs processing delays and inland evacuation constraints continue to create congestion risks and may affect cargo flows.
Veracruz: The 7-day average vessel waiting time is around 1 day. Elevated congestion levels continue to place pressure on terminal capacity, vessel schedules and cargo movements, resulting in ongoing operational delay
United States
Average import rail dwell and transit time for US cargo (Vessel arrival to departure rail ramp):
- Halifax- 13 days
- Montreal- 5 days
- Prince Rupert- 3 days
- Saint-John- 4 days
- Charleston- 1 day
- Newark- 1 day
- Wilmington- 1 day
- Los Angeles- 3 days
- Long Beach- 3 days
- New York- 1 day
- Miami- 1 day
- Oakland- 6 days
- Norfolk- 2 days
- Philadelphia- 5 days
- Savannah- 2 days
- Tacoma- 4 days
South and Central America
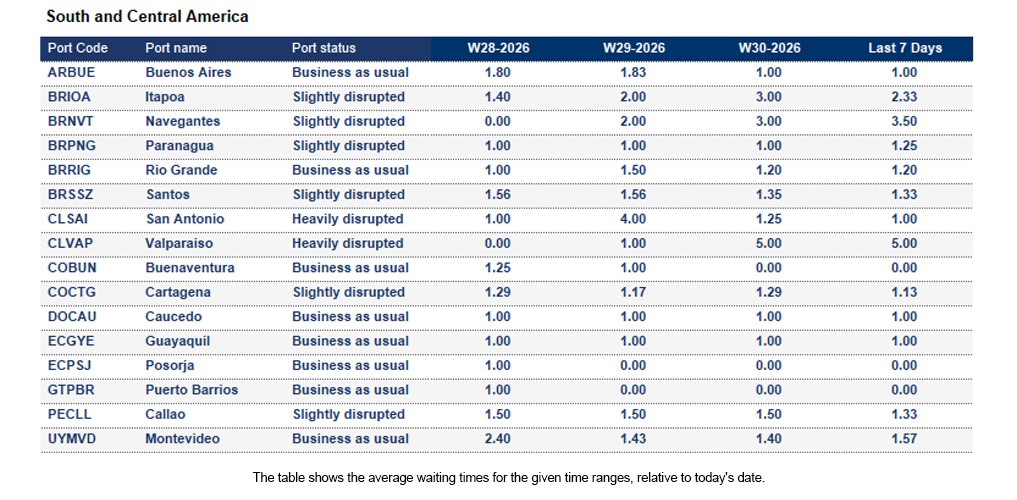
Chile
Port operations have largely returned to normal; however, significant backlogs, vessel delays and equipment shortages (20’, 40’ and HC containers) continue to impact cargo flows. Adverse weather conditions, including heavy swells, strong winds and rainfall, are still affecting operations, while recovery efforts and equipment repositioning delays continue across the country.The Los Libertadores border crossing between Argentina and Chile remains closed due to heavy snowfall, with reopening currently expected around 4 August, subject to weather conditions. Large truck queues have formed, and clearing the backlog could take up to a week once the border reopens. Read more here
How Kuehne+Nagel estimates port disruption statuses
Seaexplorer has four port statuses that are estimated based mainly on the 7-day average vessel waiting time. Other factors include yard congestion, labour strikes, natural disasters or intermodal disruptions. Slightly different rules are applied to major ports, or ports that are hubs in their region, as they are typically more efficient.
- Business as usual means the port is currently operating without any significant disruption.
- Slightly disrupted is used if the 7-day average vessel waiting time exceeds 2 days.
- Heavily disrupted if the 7-day average vessel waiting time exceeds 4 days.
- Port closure is used when the port suspends operations due to a major disruptive event.
How Kuehne+Nagel calculates the 7-day average vessel waiting time
Mainline container vessels may spend a certain number of days waiting at designated anchorage areas before their scheduled port call.
To calculate the 7-day average waiting time, we consider the waiting days of these vessels, excluding:
- Waiting times for feeder vessels,
- Idle ships without an announced next port,
- Slow steamers heading toward the anchorage, but not actively waiting within the designated area
- Vessels passing through the anchorage area without intending to call at the port.
This rolling average is based on the last 7 days of data and is updated daily in seaexplorer. To find the latest waiting time for a port, enter the port name or code in the search bar and select the relevant option.
Stay Ahead, Stay Informed: Register for seaexplorer for the latest disruptions and vessel waiting times at global container ports.