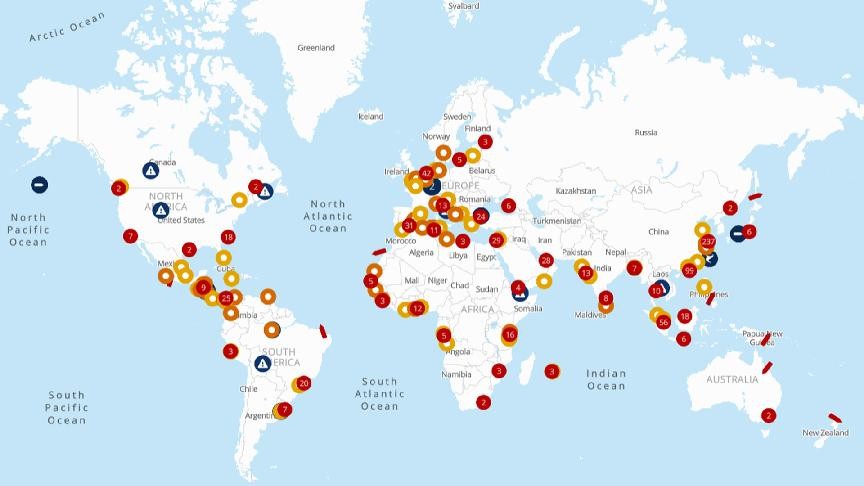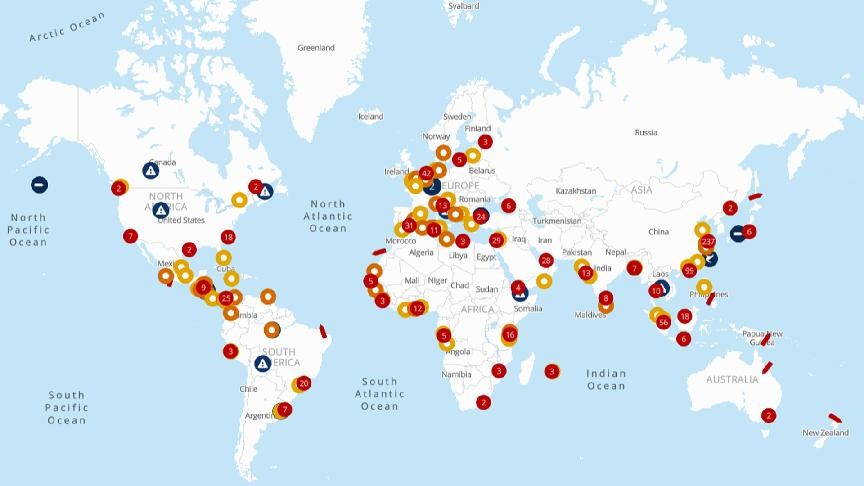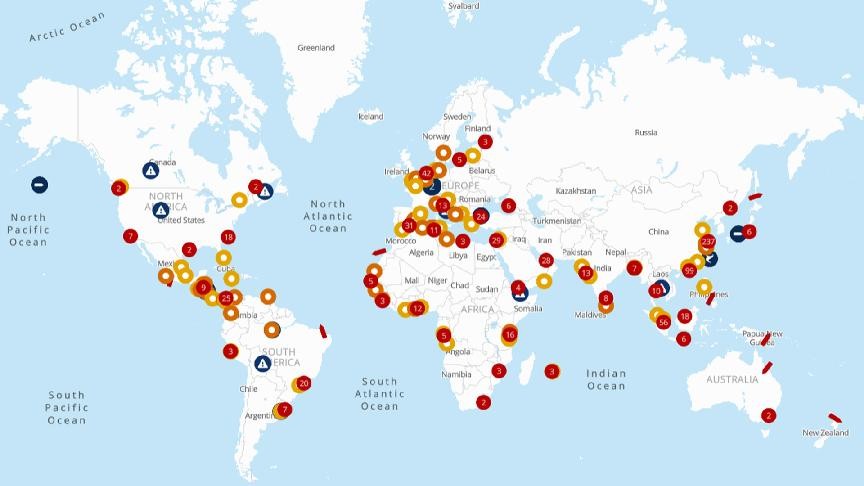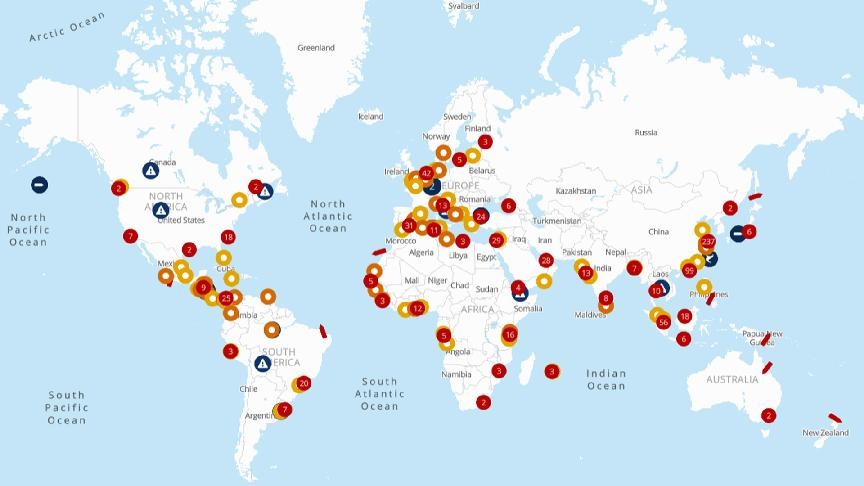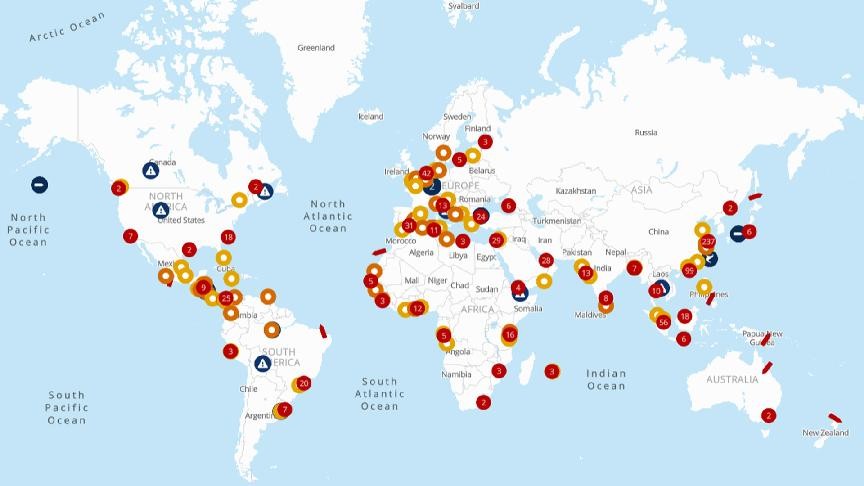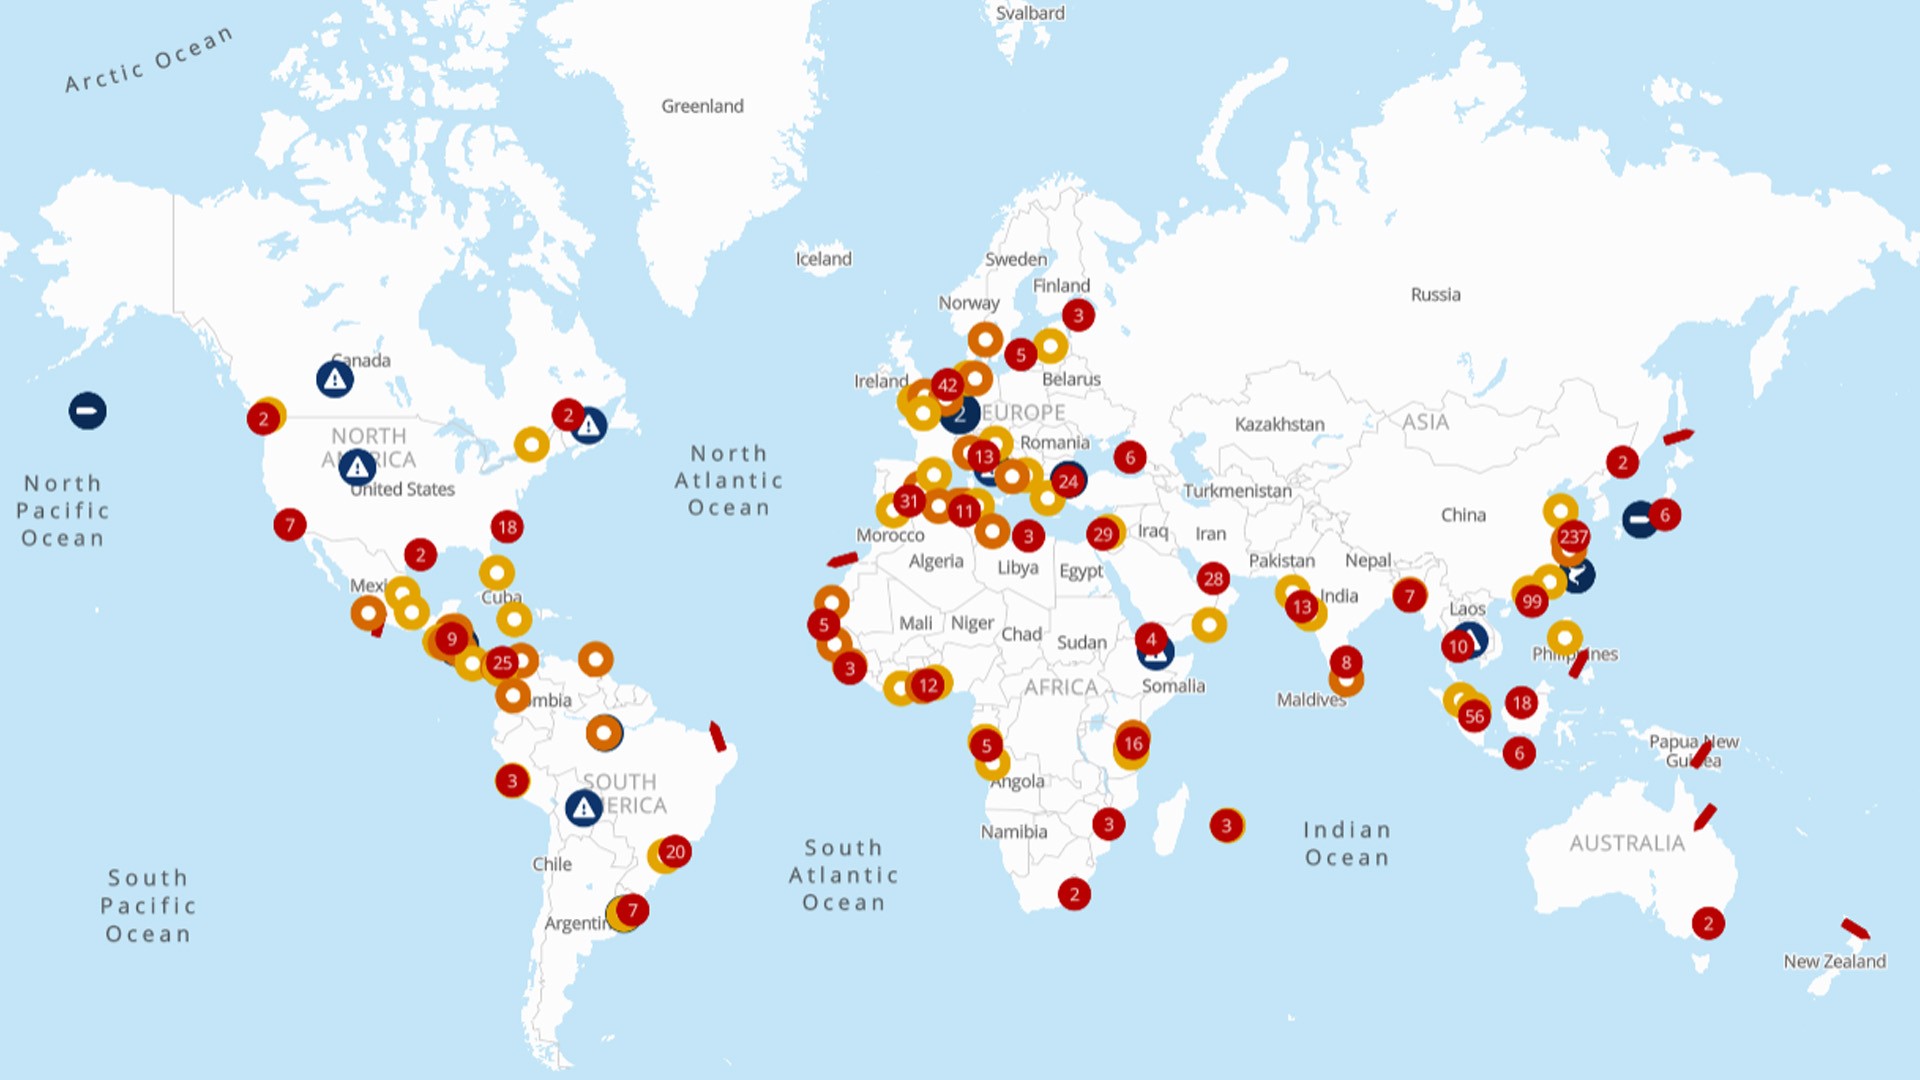

- Stay ahead of supply chain disruptions and port congestion with Kuehne+Nagel’s weekly port operational update.
- Find out the latest vessel waiting times and status of ports in Africa, Asia Oceania, Europe, Middle East-Indian Subcontinent, North America, and South and Central America.
Africa
Ghana
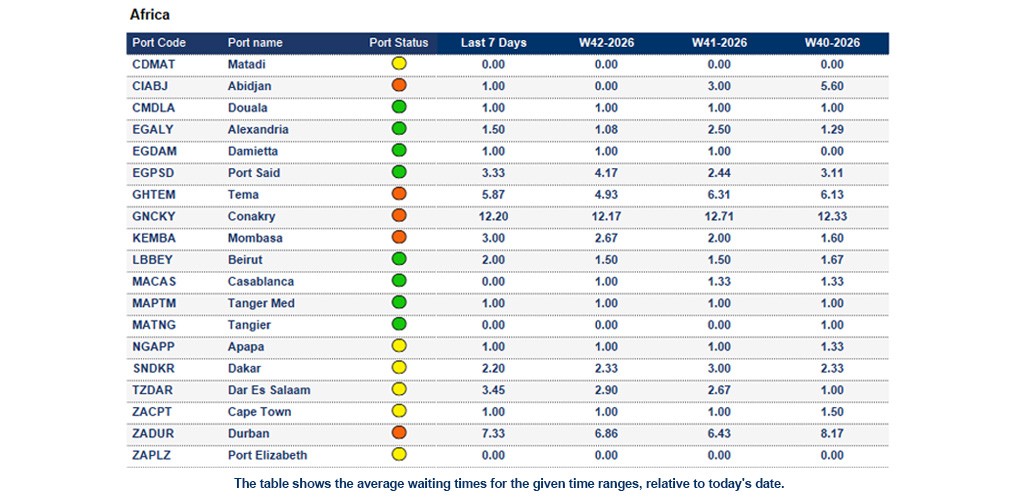
Tema: The 7-day average vessel waiting time is around 5.87 days. Delays persists, driven by high yard utilisation, trucking shortages and strong import demand. Berth flexibility also remains limited for non-window vessels.
Guinea
Conakry: The 7-day average vessel waiting time is around 12.2 days. Congestion remains severe, with berth allocation managed on a first-come, first-served basis and limited to one vessel per shipping line.
Kenya
Mombasa: The 7-day average vessel waiting time is around 3.0 days. Delays continue, with high yard utilisation, empty-container repositioning imbalances, customs and documentation delays, and trucking constraints affecting performance.
Liberia
Monrovia: The 7-day average vessel waiting time is around 5.67 days. Yard congestion remains high. Terminal capacity continues to be impacted by the maintenance closure of one berth, which is expected to remain unavailable until the end of November.
Madagascar
Toamasina: The 7-day average vessel waiting time is around 4.0 days. Truck delays continue to restrict yard fluidity, while limited direct mainline services remain a constraint.
Mauritius
Port Louis: The 7-day average vessel waiting time is around 3.0 days. Terminal performance remains stable. Current vessel schedule disruption is mainly linked to delays originating in other regions, including Asia and South Africa.
Mozambique
Beira: The 7-day average vessel waiting time is around 13.0 days. Conditions remain critical. Terminal recovery is ongoing, while intermittent wind gusts and rainfall may add further operational pressure.
Maputo: The 7-day average vessel waiting time is around 1 day. Intermittent wind and rainfall are expected.
Republic of the Congo
Pointe Noire: The 7-day average vessel waiting time is around 4.89 days. The terminal remains heavily congested, with yard occupancy reaching approximately 95%. Current delays are around three days. Fixed window and FIFO berthing systems have been suspended, with priority now given to vessels carrying larger cargo volumes to accelerate yard recovery. Feeder vessels continue to experience extended waiting times, particularly those dependent on mainline connections.
Senegal
Dakar: The 7-day average vessel waiting time is around 2.2 days. Out-of-window vessels are experiencing delays of up to 72 hours. Yard utilisation remains elevated at over 82%, requiring close monitoring as cargo volumes increase.
South Africa
Cape Town: The 7-day average vessel waiting time is around 1 day. Conditions remain comparatively stable, with CTCT reporting 0-2 days of delays and MPT 0-1 day. Equipment repairs remain ongoing at MPT, while strong winds forecasts could affect operations.
Durban: The 7-day average vessel waiting time is around 7.33 days. Severe congestion continues across both terminals. Pier 1 is experiencing 6-11 days of delays, with isolated reports of up to 14 days, while DGT faces 10-16 days, with some vessels delayed by up to 25 days. Equipment failures, landside congestion and waterside constraints continue to affect terminal performance, prompting some carriers to omit Durban and reroute cargo through alternative ports.
Port Elizabeth: The 7-day average vessel waiting time is around 0.0 days. PECT remains fluid with 0-1 day delay, while NCT reports 2-3 days due to reduced productivity. Yard density may increase as vessels and cargo are rerouted from Durban.
Asia Oceania
China
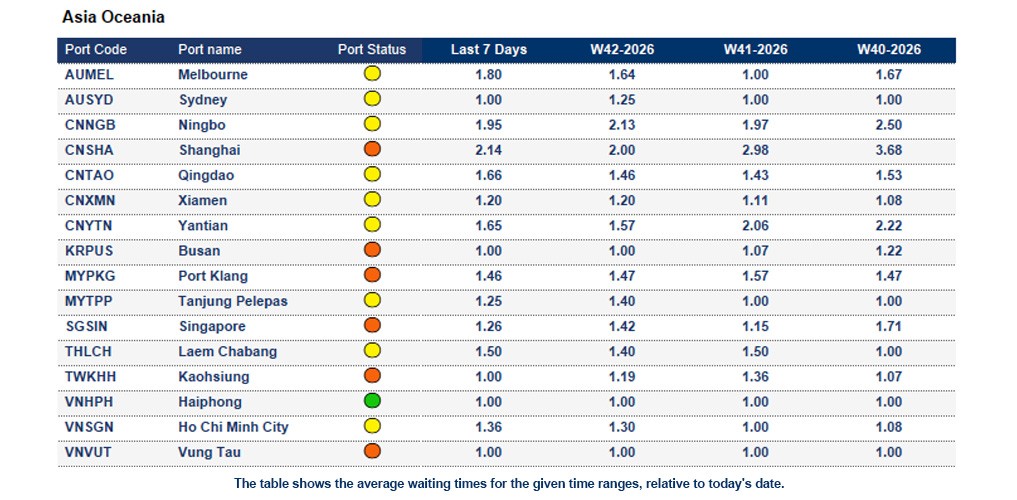
Ningbo: The 7-day average vessel waiting time is around 1.95 days. Port conditions have improved following Golden Week, with yard density returning to normal levels. However, increasing cargo volumes are beginning to extend port stays. Maintenance dredging at MSICT and YZCT continues to cause delays. A berth closure for crane upgrades between 17-20 October may create additional pressure.
Qingdao: The 7-day average vessel waiting time is around 1.66 days. Yard occupancy is around 80%. Completion of berth dredging works at QQCTN is expected to help ease congestion and improve operational stability.
Shanghai: The 7-day average vessel waiting time is around 2.14 days. Congestion improved across terminals with reduced vessel waiting times, although some terminals continue to experience higher delays.
Shekou: The 7-day average vessel waiting time is around 1.15 days. Yard density remains above 90%, resulting in berth prioritisation measures for heavy discharge vessels. Contingency actions, including double berthing between terminals, are being implemented to control yard utilisation and maintain operations.
Hong Kong
Hong Kong: The 7-day average vessel waiting time is around 1.11 days. Congestion has eased as backlog cargo and vessels are cleared. However, terminal yard utilisation remains high at 80-85%, continuing to affect overall operational efficiency.
Indonesia
Jakarta: The 7-day average vessel waiting time is around 1.18 days. Heavy berth congestion remains in place. Berth allocation continues on a first-come, first-served basis, while five new cranes are expected to enter service in early November, providing additional capacity.
Japan
Tokyo: The 7-day average vessel waiting time is around 1.45 days. Container yard density remains elevated, particularly at AOM where utilisation has reached 119%. Discharge vessels are facing average waiting times of approximately two days due to limited yard capacity.
Malaysia
Port Klang: The 7-day average vessel waiting time is around 1.46 days. Yard occupancy remains high at 85-90%. To avoid further congestion, planned maintenance dredging at Berth 22 has been postponed until the end of October.
Philippines
Manila: The 7-day average vessel waiting time is around 3.72 days. Congestion persists across both Manila North and Manila South. Off-window vessels are experiencing delays of 1.5-2 days in Manila North and 2-3 days in Manila South.
Singapore
Singapore: The 7-day average vessel waiting time is around 1.26 days. Strong carrier demand continues to keep PSA terminals under pressure, with congestion persisting across the port.
South Korea
Busan: The 7-day average vessel waiting time is around 1 day. Conditions remain critical at BNCT, where yard utilisation continues to exceed 90%. High density is significantly impacting productivity, vessel line-ups and berth availability. Heavy discharge vessels may be deprioritised until yard capacity improves.
Taiwan
Kaohsiung: The 7-day average vessel waiting time is around 1 day. Heavy yard congestion continues at CCKT, with utilisation remaining above 90% and placing pressure on terminal operations.
Vietnam
Ho Chi Minh City: The 7-day average vessel waiting time is around 1.36 days. Congestion persists at Cat Lai. Yard utilisation remains within normal levels at 70-80%.
Vung Tau: The 7-day average vessel waiting time is around 1 day. Heavy berth congestion continues at GML with delays of up to four days for off-window vessels. Yard density remains above 90%, impacting terminal productivity despite ongoing congestion-mitigation measures.
Europe
Belgium
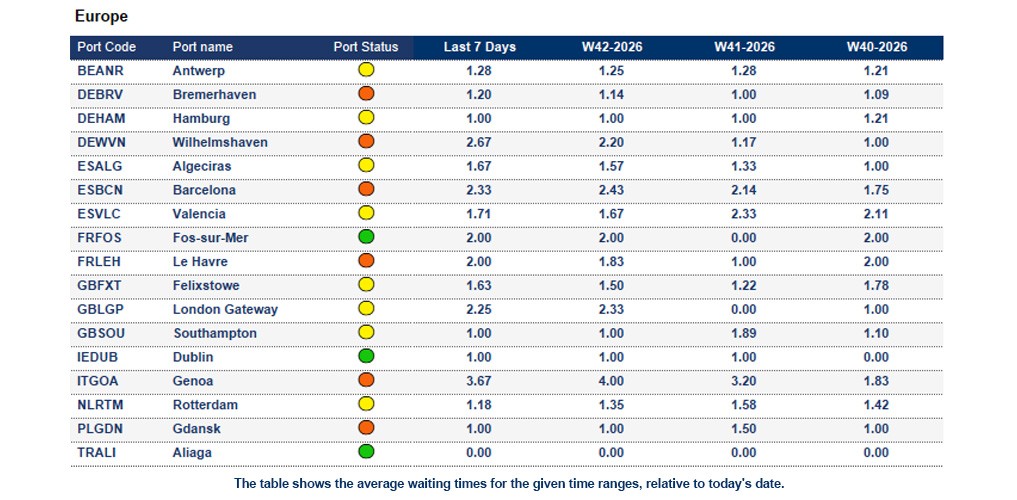
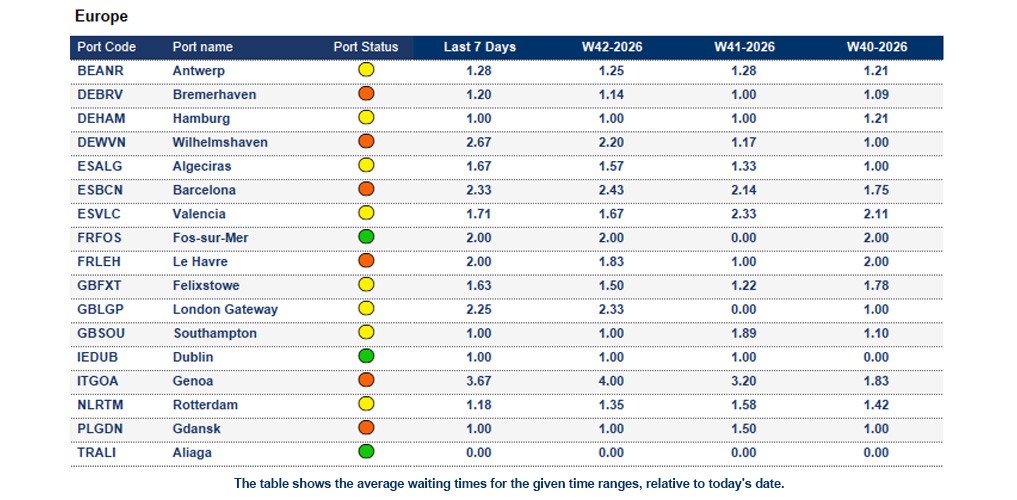
Antwerp: The 7-day average vessel waiting time is around 1.26 days. Yard utilisation remains high at both terminals, with Q869 at 88% and Q913 at 90%. Truck turnaround times remain efficient at 24-33 minutes; however, berth congestion at Q913 continues to create delays for some vessel calls.
France
Le Havre: The situation remains unchanged following the cyber attack affecting TNMSC Terminal. Recovery efforts are ongoing, but the terminal remains closed, with no container gate-in or gate-out operations currently possible. No confirmed timeline has been provided for the resumption of normal operations. Empty containers can, however, still be picked up and returned via private depots such as MEDREPAIR and ARNAL Le Havre. Once terminal operations resume, significant congestion and operational backlogs are anticipated.
Germany
Bremerhaven: The 7-day average vessel waiting time is around 1.2 days. Yard occupancy has reached 91%, creating increasing pressure on terminal capacity, particularly for IMO and out-of-gauge cargo. Vessel schedules remain largely on track, although continued high yard density presents a growing operational risk.
Hamburg: The 7-day average vessel waiting time is around 1 day. Hamburg terminals continue to operate under elevated yard pressure, with occupancy levels ranging between 81% and 90%. A busy mainline vessel programme and closely scheduled arrivals are expected to continue into next week, while labour availability remains constrained by the autumn school holiday period. Despite high yard utilisation and a packed line-up, operations remain stable, with recent vessel delays absorbed without major disruption and no immediate concerns regarding terminal fluidity.
Wilhelmshaven: The 7-day average vessel waiting time is around 2.67 days. Operations remain under pressure with yard density around 80%. Several heavily delayed vessels, are impacting berth planning. Reduced labour availability continues to constrain recovery efforts. Improvement is expected from CW44 onwards.
Netherlands
Rotterdam: The 7-day average vessel waiting time is around 1.18 days. Rotterdam presents a mixed operational picture. Yard occupancy remains elevated at 86-90% at ECT and MVII, resulting in berth planning adjustments, limited reefer plug availability and ongoing barge and feeder delays of 12-72 hours. Several late-arriving vessels continue to pressure operations, while a scheduled outage at MVII may create additional disruption. In contrast, Delta II remains fluid, with yard occupancy at only 29% and no significant operational constraints reported across deep-sea, feeder or barge activities.
United Kingdom
London Gateway Port: The 7-day average vessel waiting time is around 2.25 days. Terminal density remains manageable, with yard occupancy at 67% for dry cargo and 53% for reefers. Berth operations continue to be affected by crane installation works, reducing available berth length and causing delays to vessel line-ups. Additional disruption from pilot station closures and variable productivity has also impacted schedules. A major terminal operating system upgrade planned for 31 October could result in a temporary operational stoppage.
Indian Subcontinent
India
Chennai: The 7-day average vessel waiting time is around 1 day. Delays have increased, with operations facing network pressure due to reliance on regional transshipment hubs.
Mundra: The 7-day average vessel waiting time is around 1.5 days. Vessel delays continue, while capacity on the India-South Africa trade remains tight.
Nhava Sheva: The 7-day average vessel waiting time is around 1.87 days. Vessel delays continue, while capacity on the India-South Africa trade remains tight. Waiting Time: 1.87 days.
Sri Lanka
Colombo: The 7-day average vessel waiting time is around 1.39 days. High transshipment volumes and yard density continue to cause vessel omissions and missed feeder connections. Congestion is expected to persist through at least the remainder of October.
North America
Canada
Average rail dwell times:
- Halifax: 5
- Montreal: 6
- Prince Rupert: 5
- Saint John: 7
- Vancouver: 5
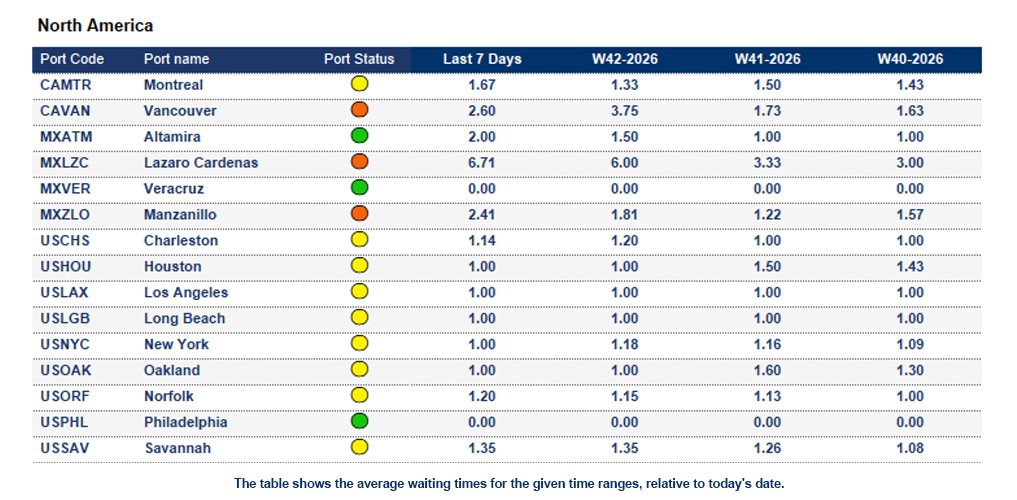
Vancouver: The 7-day average vessel waiting time is around 2.6 days. Delays continue, with tight vessel capacity, limited West Coast space availability and reliance on inland rail performance continuing to constrain cargo flows.
Mexico
Manzanillo: The 7-day average vessel waiting time is around 2.41 days. Nearshoring-driven volume growth, customs delays, road access constraints and capacity limitations are affecting performance. Recent Pacific storms have also disrupted operations and vessel schedules.
United States
Average rail dwell times:
- Halifax - 2 days
- Montreal - 6 days
- Prince Rupert - 6 days
- Saint-John - 8 days
- Vancouver - 5 days
- Baltimore - 6 days
- Charleston - 3 days
- Newark - 3 days
- Houston - 6 days
- Wilmington - 11 days
- Jacksonville - 14 days
- Los Angeles - 8 days
- Long Beach - 10 days
- Miami - 13 days
- Mobile - 2 days
- New York - 4 days
- New Orleans - 4 days
- Oakland - 5 days
- Norfolk - 3 days
- Port Everglades - 7 days
- Philadelphia - 3 days
- Savannah - 2 days
- Seattle - 5 days
- Tacoma - 5 days
Long Beach & Los Angeles: The 7-day average vessel waiting time is around 1 day. Rail dwell times are presenting a risk of additional cargo delays.
New York: The 7-day average vessel waiting time is around 1 day. Delay persists amid strong import demand and large vessel arrivals. Inland drayage constraints and chassis availability are adding pressure, although overall port performance remains acceptable.
Savannah: The 7-day average vessel waiting time is around 1.35 days. Delays continue, with elevated container volumes, chassis shortages and increased drayage delays affecting inland cargo movements.
South America
Argentina
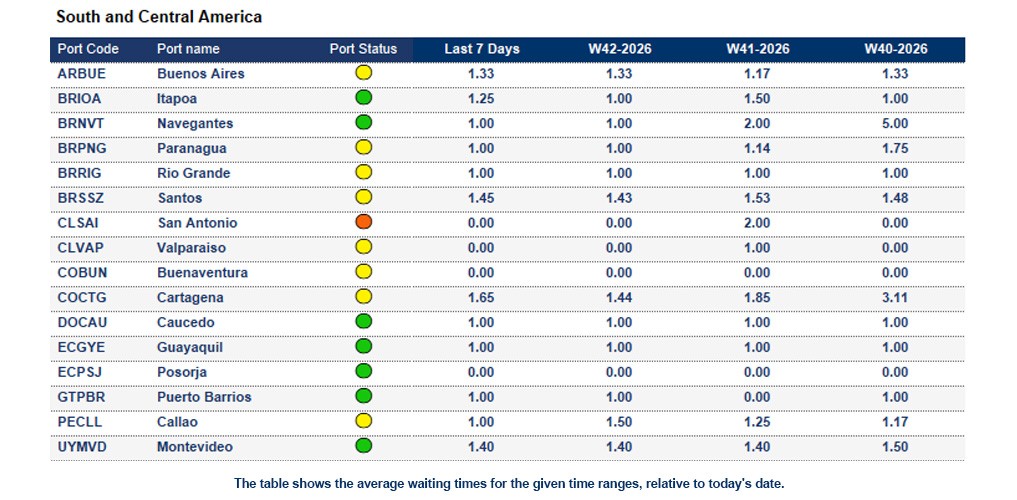
Buenos Aires: The 7-day average vessel waiting time is around 2.0 days. Delays have increased. Inland trucking, river transport availability, customs procedures and the regulatory environment continue to present operational challenges.
Brazil
Santos: The 7-day average vessel waiting time is around 1.45 days. Delays continue, driven by high agricultural and container volumes, vessel bunching and inland transport capacity constraints.