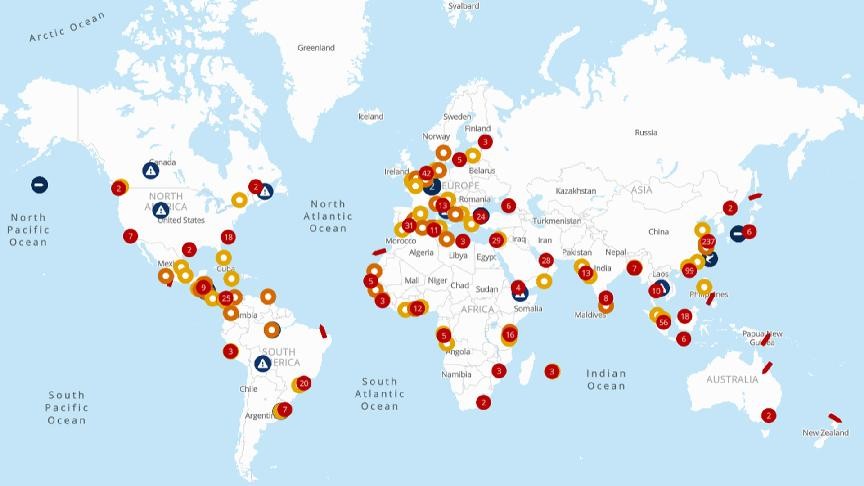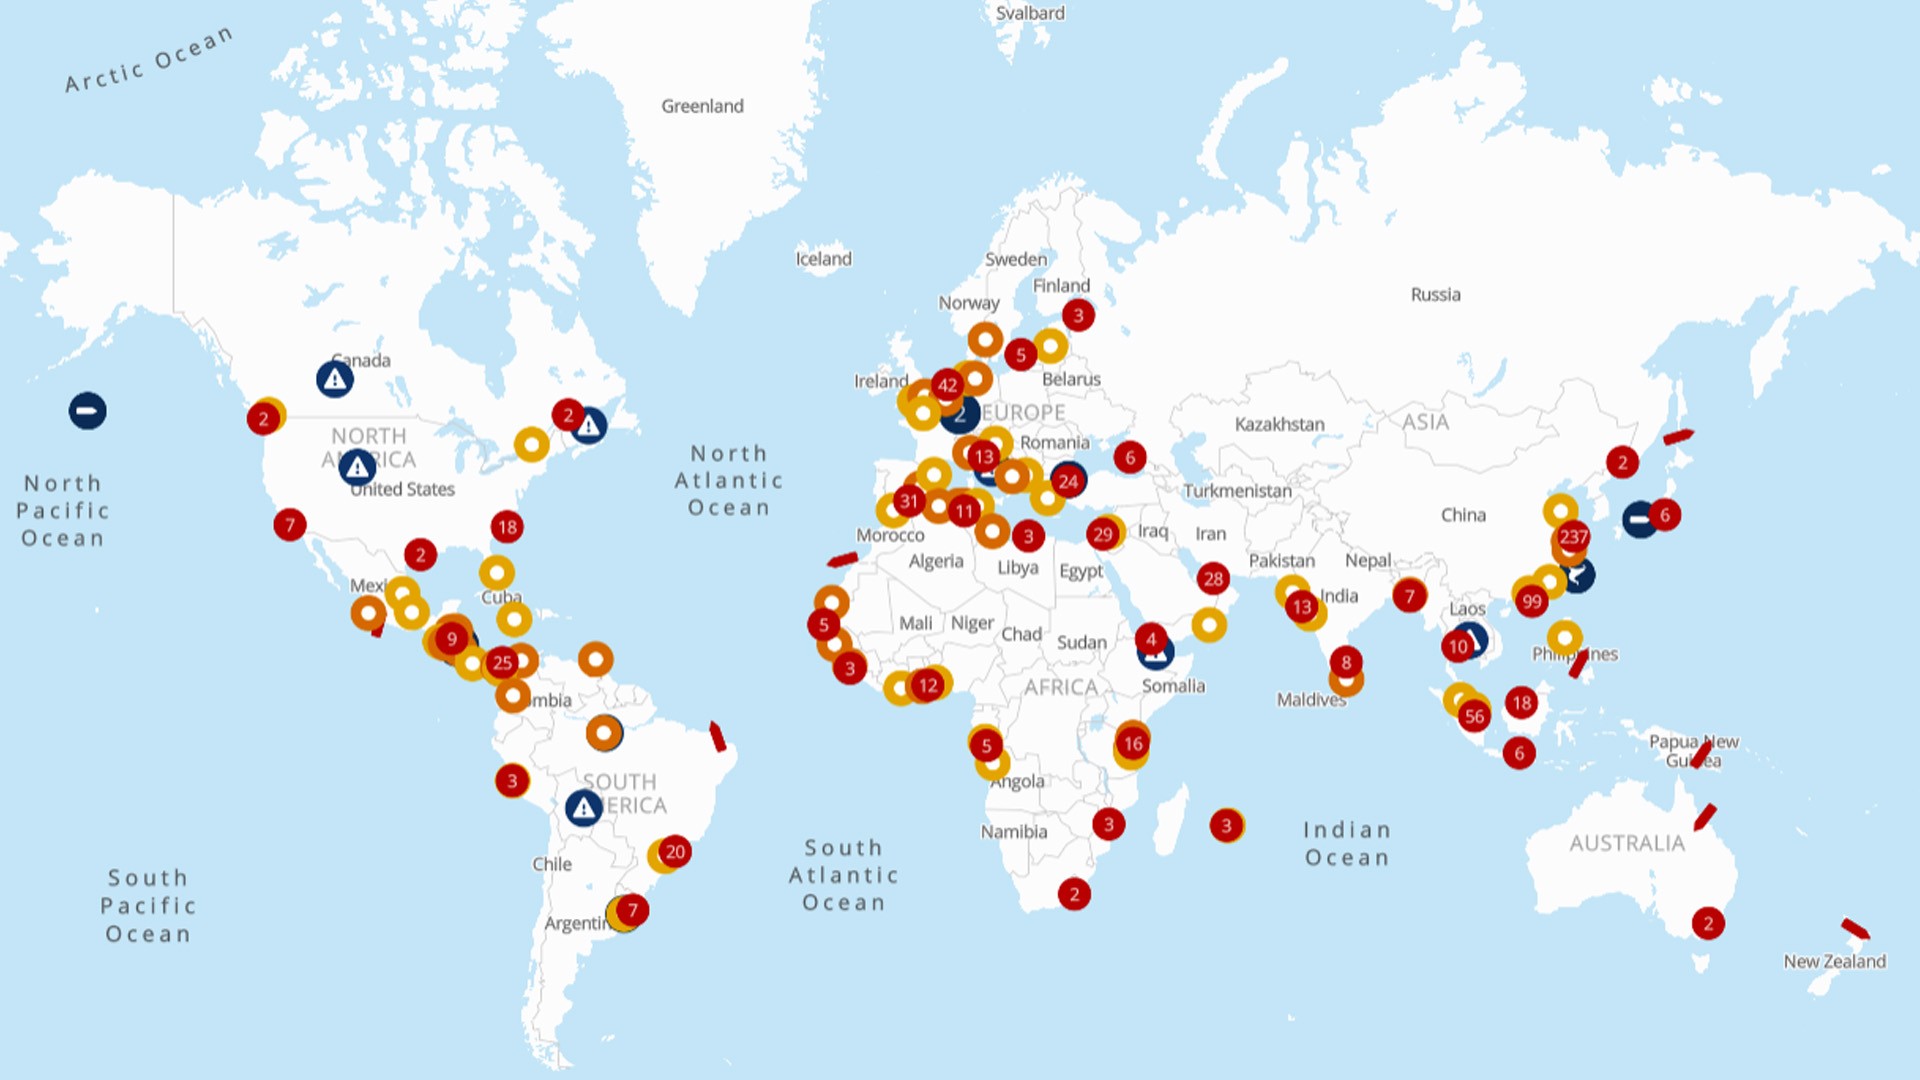

Stay ahead of supply chain disruptions and port congestion with Kuehne+Nagel’s weekly port operational update.
- Find out the latest vessel waiting times and status of ports in Africa, Asia Oceania, Europe, Middle East-Indian Subcontinent, North America, and South and Central America.
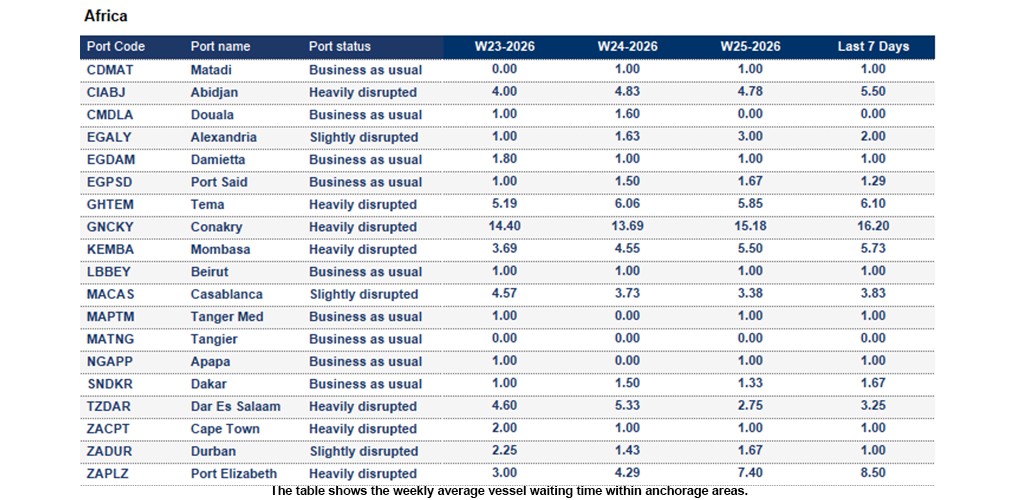
Africa
Ghana
Tema: The 7-day average vessel waiting time is around 6.1 days.
Guinea
Conakry: The 7-day average vessel waiting time is around 16.2 days. Severe congestion with long vessel waiting times, limited storage capacity and insufficient empty containers; mitigation measures include continuous truck circulation.
Ivory Coast
Abidjan: The 7-day average vessel waiting time is around 5.5 days.
Kenya
Mombasa: The 7-day average vessel waiting time is around 5.73 days. Persistent congestion at terminals and extended vessel queues continue to pressure operations, exacerbated by empty container imbalances and high yard utilisation. Customs clearance delays are further constraining throughput, while truck shortages, road disruptions and flood‑damaged infrastructure along key corridors are significantly impacting inland cargo flows.
Morocco
Casablanca: The 7-day average vessel waiting time is around 3.83 days.
Mozambique
Beira: The 7-day average vessel waiting time is around 15.7 days. Beira Terminal continues to face operational constraints, with full recovery and a return to normal service levels expected by weeks 32–33.
South Africa
South African port operations were impacted by nationwide COSATU protest action on 19 June. Port access and logistics movements faced disruption, resulting in delays and congestion across several terminals. Waterside operations largely continued as planned, while TPT implemented contingency measures and closely monitored the situation.
Port Elizabeth: The 7-day average vessel waiting time is around 8.5 days. Coega is experiencing operational challenges due to seasonal tidal restrictions and backlogs resulting from recent adverse weather conditions, impacting terminal productivity and cargo flows.
Tanzania
Dar Es Salaam: The 7-day average vessel waiting time is around 3.25 days. Moderate terminal congestion persists, with delays varying by service and berth allocation. Increasing cargo volumes, driven by diversions from Mombasa and Horn routes, are placing additional pressure on terminal capacity.
The Gambia
Banjul: The 7-day average vessel waiting time is around 7.67 days.
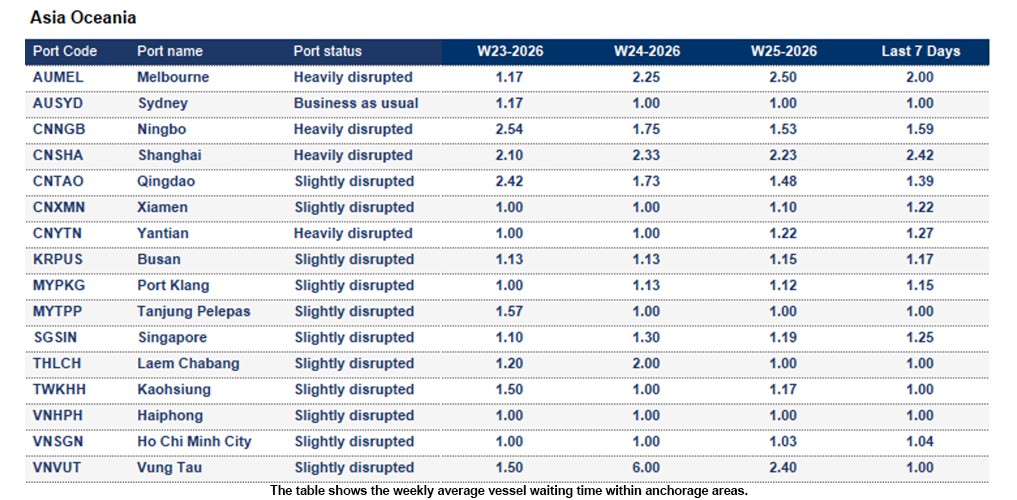
Asia Oceania
China
Ningbo: The 7-day average vessel waiting time is around 1.59 days. MSICT yard occupancy remains critically high at 95%, with reefer utilisation at 85%, while other terminals are operating at 71% occupancy. Elevated yard density, driven by a recent cargo surge and carriers' PIPO activity, is impacting productivity and extending vessel waiting times to 1.5–2 days.
Shanghai: The 7-day average vessel waiting time is around 2.42 days. Dense fog disrupted operations on 18 June, resulting in port closures of 4.7 hours at WGQ and 11.8 hours at YS. Yard occupancy stands at 70% in WGQ and 86% in YS12. Concentrated mainline vessel arrivals continue to drive waiting times of up to 4 days at YGS12 and 2 days at WGQ2, while increased cargo volumes are extending vessel port stays.
Shekou: The 7-day average vessel waiting time is around 1.29 days. From 14 June, SCT is expected to face significant congestion, with average waiting times of 1–1.5 days. The yard density also remains high, with laden units above 90% and empty units around 85%.
Yantian: The 7-day average vessel waiting time is around 1.27 days. Yantian Port remains congested, with average vessel waiting times of 1–1.5 days. Congestion is particularly acute for vessels under 366m LOA due to ongoing crane heightening works, equipment breakdowns and adverse weather. Two cranes at Berth 5 remain out of service, reducing productivity, while six cranes at Berth 9 are undergoing upgrades, with the berth expected to remain unavailable until August.
Indonesia
Belawan, Sumatra: The 7-day average vessel waiting time is around 2.13 days. Berth congestion persists, with off‑window vessels generally facing 1–2 days of waiting and delay.
Semarang: The 7-day average vessel waiting time is around 2.5 days. Overall conditions are stabilising, though the port remains congested.
Surabaya: The 7-day average vessel waiting time is around 1.23 days. The port remains congested, with waiting times of around one day. A 200‑metre quay is still closed for the commissioning of new QC equipment, reducing berth availability and operational flexibility.
New Zealand
Auckland: The 7-day average vessel waiting time is around 2.0 days.
Tauranga: The 7-day average vessel waiting time is around 2.0 days.
Singapore
Singapore: The 7-day average vessel waiting time is around 1.25 days. PSA remains busy, with general waiting times of more than one day for all carriers. Yard utilisation also stays at a high level, with density around 80–85%.
South Korea
Busan: The 7-day average vessel waiting time is around 1.17 days. BNCT operations remain stable, with laden yard density at 70% and no significant congestion reported during week 25. However, congestion risks are expected to increase next week due to volatile vessel arrival patterns. In addition, annual electrical maintenance resulted in a 10-hour suspension of terminal and gate operations on 18 June across all Busan New Port terminals, except DGT.
Vietnam
Cai Mep International Terminal: The 7-day average vessel waiting time is around 2.5 days.
Ho Chi Minh City: The 7-day average vessel waiting time is around 1.04 days. Cat Lai operations remain stable, with vessel waiting times generally limited to 0.5–1 day. Yard congestion has eased and stabilised, with utilisation maintained at approximately 90% during week 25.
Vung Tau: The 7-day average vessel waiting time is around 1 day. Gemalink Terminal operations remain stable, with only minor berth congestion and vessel waiting times of approximately one day during week 25. However, yard utilisation remains elevated at 90–95%, requiring close monitoring as volumes continue to remain high.
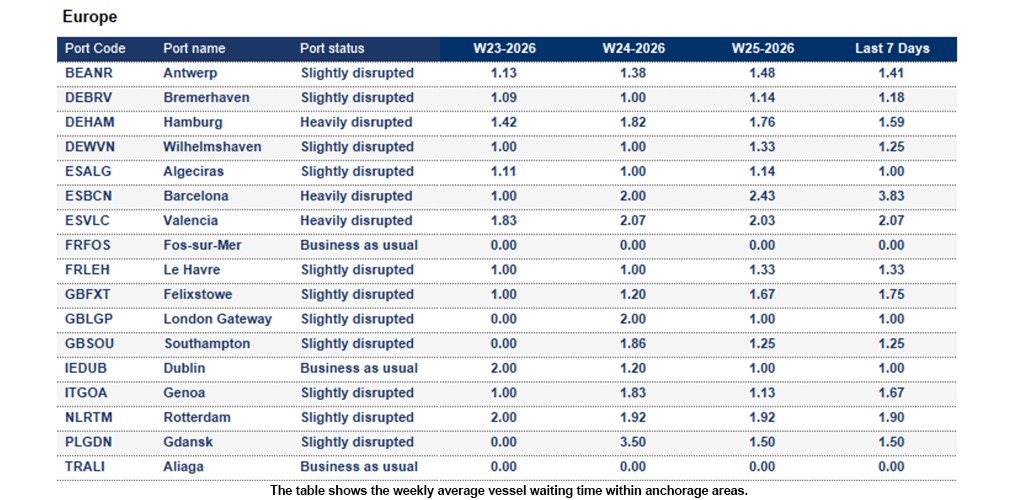
Europe
Belgium
Antwerp: The 7-day average vessel waiting time is around 1.41 days. Yard utilisation remains manageable at 71–73%, with truck turnaround times of 18–32 minutes and normal barge operations. However, vessel line-ups remain affected by pilot actions, while 100 metres of quay wall capacity is unavailable until 25 June due to maintenance. Labour availability is reduced at weekends, requiring close operational monitoring.
Germany
Bremerhaven: The 7-day average vessel waiting time is around 1.18 days. Yard occupancy is at 80% and remains manageable, though IMO/OOG slots remain tight.
Hamburg: The 7-day average vessel waiting time is around 1.59 days. Yard occupancy is 85% with IMO reefer restrictions. Terminal remains congested, with delays for non‑Gemini vessels. Crane issues cut Berth 1–2 availability from 5 to 3; labour shortages expected this weekend. Terminal operates above capacity; further WK28/29 restrictions likely. CTH at 85%, IMO 9 discharge constrained; fast import pick‑up needed. Operational limitations are expected at HHLA terminals on 30 June due to staff assemblies.
Wilhelmshaven: The 7-day average vessel waiting time is around 1.25 days. Yard density remains manageable at around 70%, and the vessel lineup for the next 72 hours is in place. However, operations remain tightly constrained due to reduced labour availability and reliance on weekend volunteers. With favourable weather and Germany’s World Cup match expected to impact staffing, any disruption to schedules, equipment, or labour could lead to immediate delays. CTA vessel departures continue to affect the CTW lineup.
Greece
Thessaloniki: The 7-day average vessel waiting time is around 2.75 days.
Ireland
Dublin: The 7-day average vessel waiting time is around 2.0 days. The port is currently experiencing significant congestion, and a number of vessels are facing delays as a result of ongoing port operations.
Netherlands
Rotterdam: The 7-day average vessel waiting time is around 1.9 days. Yard occupancy remains stable at 70%. Reefer capacity is tight due to additional volumes. Gang availability is manageable for day and evening shifts, while night shifts remain challenging as ageing personnel are excluded. Barge delays are around 24 hours, and feeder delays are around 48 hours.
MVII: Yard occupancy is at 90%.
Spain
Barcelona: The 7-day average vessel waiting time is around 3.83 days. Limited capacity buffer for additional volumes.
Valencia: The 7-day average vessel waiting time is around 2.07 days.
United Kingdom
London Gateway Port: The 7-day average vessel waiting time is around 1 day. Dry yard occupancy stands at 55% and reefer occupancy at 50%, with overall operations remaining stable. Rail services have returned to normal, although an ASC module failure resulted in 29 containers being short-shipped on IOS Alula Express. Both ship-side and landside operations are functioning normally.
Southampton: The 7-day average vessel waiting time is around 1.25 days. Operations remain stable on both the ship and landside, with yard occupancy at 76% for dry cargo and 62% for reefers. The berth plan retains some flexibility; however, SCT5 will close for seven days from 19 June, subject to weather, to facilitate the arrival and installation of new cranes.
Middle East - Indian Subcontinent
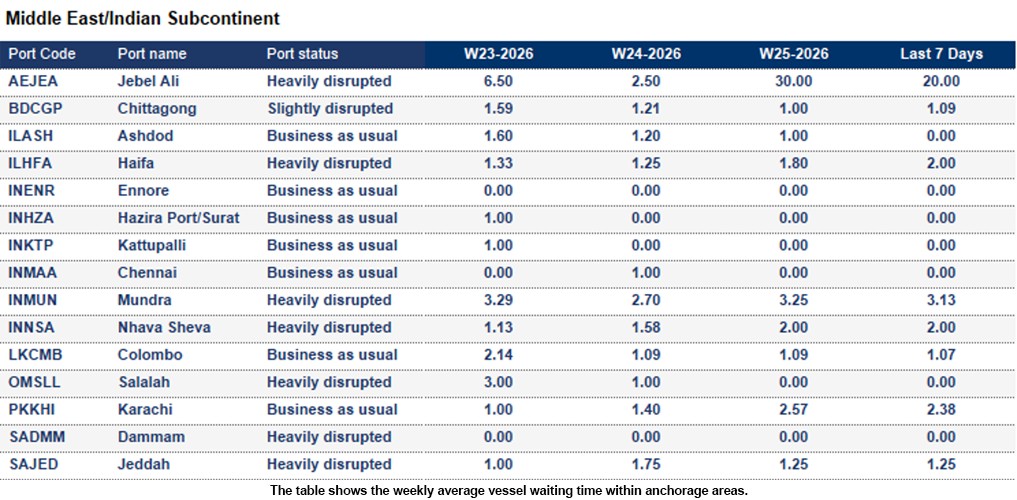
Middle East:
Over the weekend, the US and Iran issued conflicting statements on the status of the Strait of Hormuz. Despite Iran’s claim of renewed closure, traffic data shows vessel movements increasing again after both sides signed an MoU on 22 June and agreed to establish a direct communication hotline. Iran has signalled future changes to the Strait administration, with details pending. Technical talks between the US and Iran concluded today with agreement on next‑step arrangements. Middle East container ports continue operating normally, while Khor al Fakkan, Al‑Fujairah, Sohar and Salalah remain practical alternatives. Jeddah continues to face heavy congestion due to limited intermodal capacity. Read more here
Bangladesh
Chittagong (Chattogram): The 7-day average vessel waiting time is around 1.09 days. Operations remain stable with minor berthing congestion causing delays for both geared and gearless vessels.
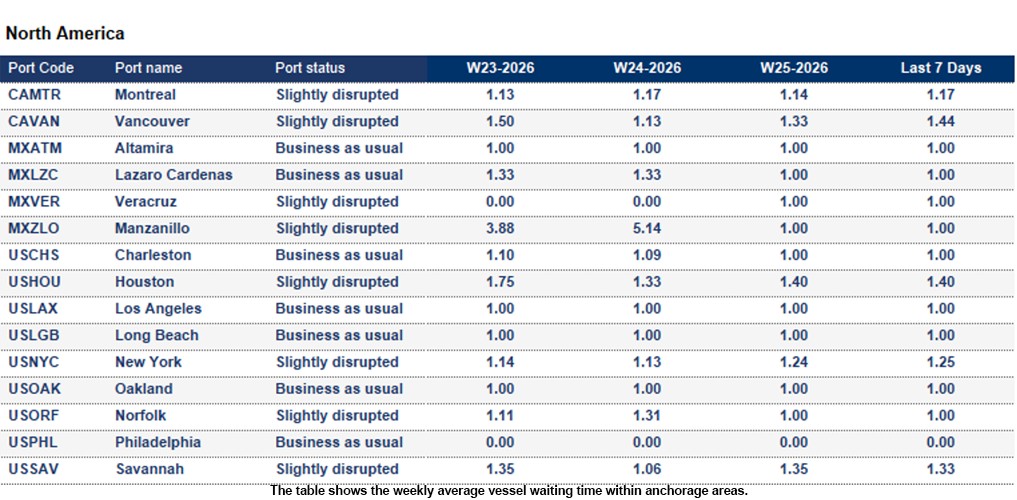
North America
Canada
Average import rail dwell time for Canadian cargo (Vessel arrival to departure rail ramp):
- Halifax: 4 days
- Montreal: 7 days
- Prince Rupert: 6 days
- Saint John: 5 days
- Vancouver: 6 days
Mexico
Veracruz: The 7-day average vessel waiting time is around 1 day. Railway maintenance works have been completed. Resulting operational disruptions caused delays, but the situation is now stabilising and gradually returning to normal.
United States
Average import rail dwell and transit time for US cargo (Vessel arrival to departure rail ramp):
- Halifax- 12 days
- Montreal- 8 days
- Prince Rupert- 7 days
- Vancouver- 7 days
- Saint-John- 7 days
- Charleston- 2 days
- Newark- 3 days
- Houston- 8 days
- Jacksonville- 3 days
- Los Angeles- 5 days
- Long Beach- 7 days
- New York- 4 days
- Miami- 1 day
- Oakland- 6 days
- Norfolk- 2 days
- Philadelphia- 10 days
- Savannah- 2 days
- Seattle- 6 days
- Tacoma- 4 days
South and Central America
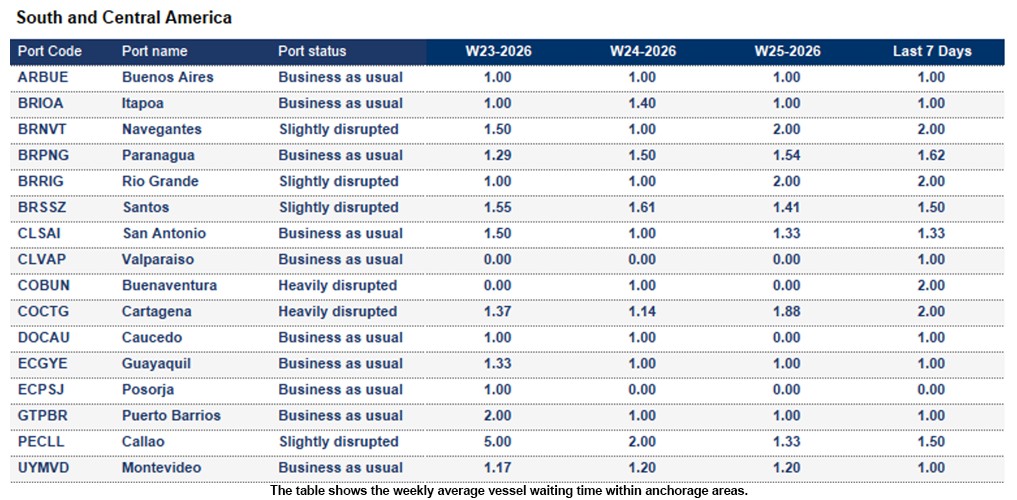
Brazil
Navegantes: The 7-day average vessel waiting time is around 2.0 days.
Rio Grande: The 7-day average vessel waiting time is around 2.0 days.
Colombia
Buenaventura: The 7-day average vessel waiting time is around 2.0 days.
Panama
Rodman: The 7-day average vessel waiting time is around 5.5 days.
How Kuehne+Nagel estimates port disruption statuses
Seaexplorer has four port statuses that are estimated based mainly on the 7-day average vessel waiting time. Other factors include yard congestion, labour strikes, natural disasters or intermodal disruptions. Slightly different rules are applied to major ports, or ports that are hubs in their region, as they are typically more efficient.
- Business as usual means the port is currently operating without any significant disruption.
- Slightly disrupted is used if the 7-day average vessel waiting time exceeds 2 days.
- Heavily disrupted if the 7-day average vessel waiting time exceeds 4 days.
- Port closure is used when the port suspends operations due to a major disruptive event.
How Kuehne+Nagel calculates the 7-day average vessel waiting time
Mainline container vessels may spend a certain number of days waiting at designated anchorage areas before their scheduled port call.
To calculate the 7-day average waiting time, we consider the waiting days of these vessels, excluding:
- Waiting times for feeder vessels,
- Idle ships without an announced next port,
- Slow steamers heading toward the anchorage, but not actively waiting within the designated area
- Vessels passing through the anchorage area without intending to call at the port.
This rolling average is based on the last 7 days of data and is updated daily in seaexplorer. To find the latest waiting time for a port, enter the port name or code in the search bar and select the relevant option.
Stay Ahead, Stay Informed: Register for seaexplorer for the latest disruptions and vessel waiting times at global container ports.