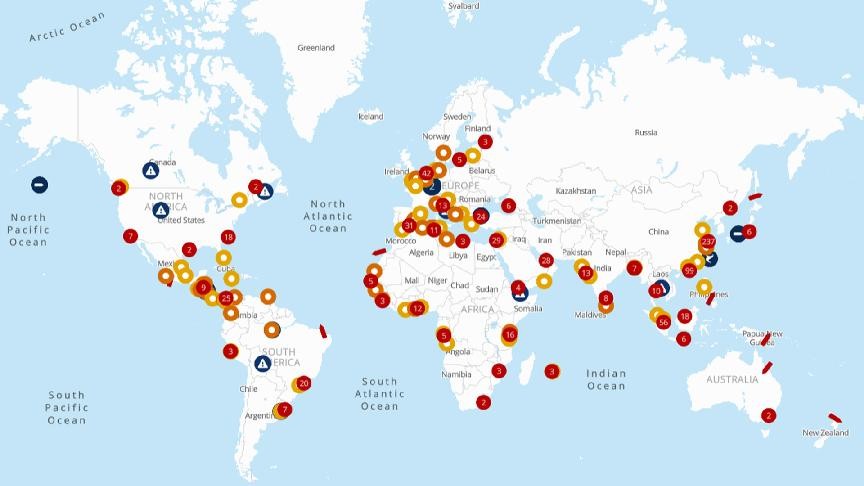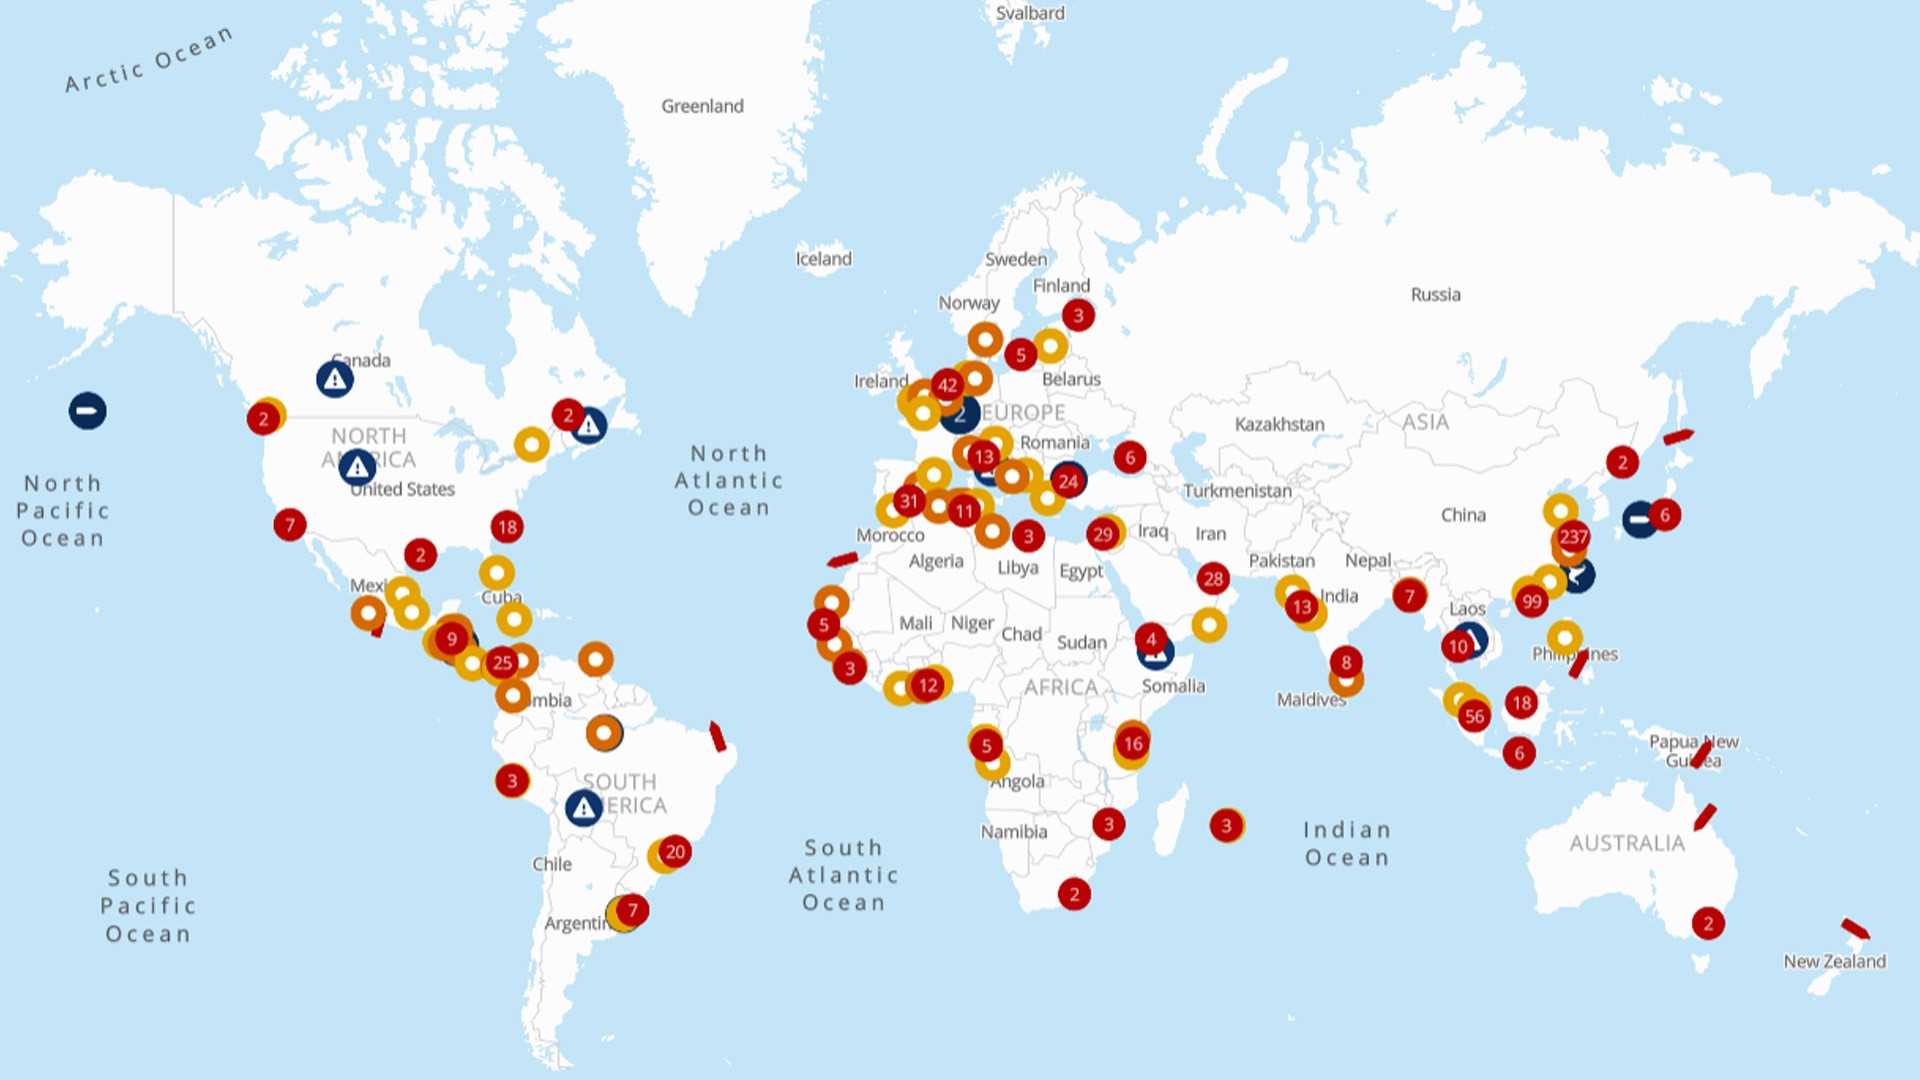

- Stay ahead of supply chain disruptions and port congestion with Kuehne+Nagel’s weekly port operational update.
- Find out the latest vessel waiting times and status of ports in Africa, Asia Oceania, Europe, Middle East-Indian Subcontinent, North America, and South and Central America.
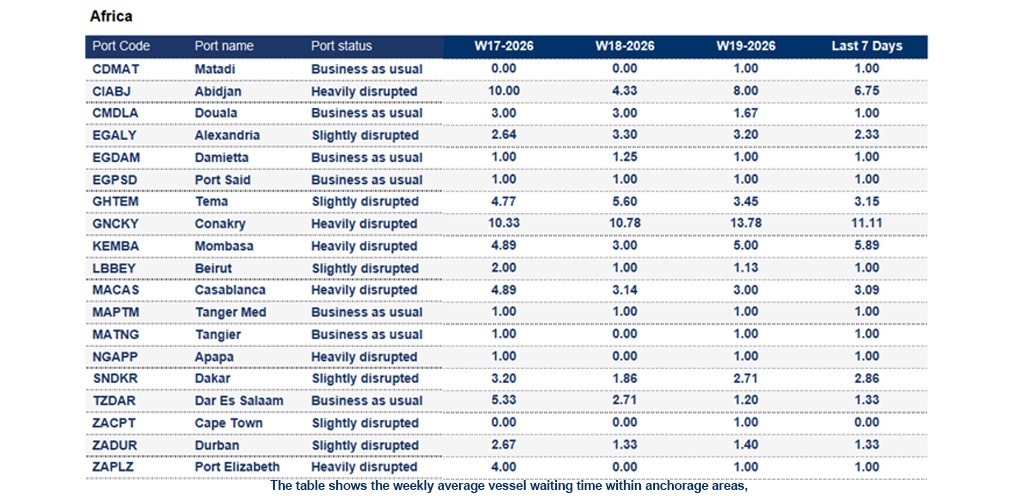
Africa
Guinea
Conakry: The 7-day average vessel waiting time this week is around 11.11 days. Severe congestion with long vessel waiting times, limited storage capacity and insufficient empty containers; mitigation measures include continuous truck circulation.
Ivory Coast
Abidjan: The 7-day average vessel waiting time is around 6.75 days. Congestion at the Port of Abidjan earlier this year highlighted longstanding structural issues. In April 2026, the Ivorian government approved the use of container barges within port waters to ease congestion, improve traffic flow, and reduce road pressure, supported by dedicated logistics zones and restricted urban truck access. This week, road congestion around terminals is affecting operations.
Mali
Following late-April 2026 attacks and new curfews, carriers and operators face delays, corridor insecurity and wider impacts on West African hinterland flows via Dakar and Abidjan. Read more.
Morocco
Casablanca: The 7-day average vessel waiting time is around 3.09 days. The yard utilisation is at 99%. The port is currently heavily congested due to infrastructure development projects, impacting cranes and mooring systems.
Nigeria
Tincan/Lagos: The 7-day average vessel waiting time is around 2.0 days. Congestion up to 4 days due to a buildup of empties and possible terminal gate closures.
Senegal
Dakar: The 7-day average vessel waiting time is around 2.86 days. Moderate congestion was observed in early April; however, conditions improved towards the end of the month. The availability of empty containers remains stable.
South Africa
Cape Town: The 7-day average vessel waiting time is around 1 day. CTCT and MPT report 0–1 day congestion with clear weather expected; improved performance noted, though high export volumes and weather volatility may impact operations.
Durban: The 7-day average vessel waiting time is around 1.33 days. Productivity has improved with smooth operations; truck turnaround times and booking slots may be impacted by berthing windows and vessel schedules.
Port Elizabeth: The 7-day average vessel waiting time is around 7.0 days. Early week weather disruptions affected performance, but conditions are expected to improve.
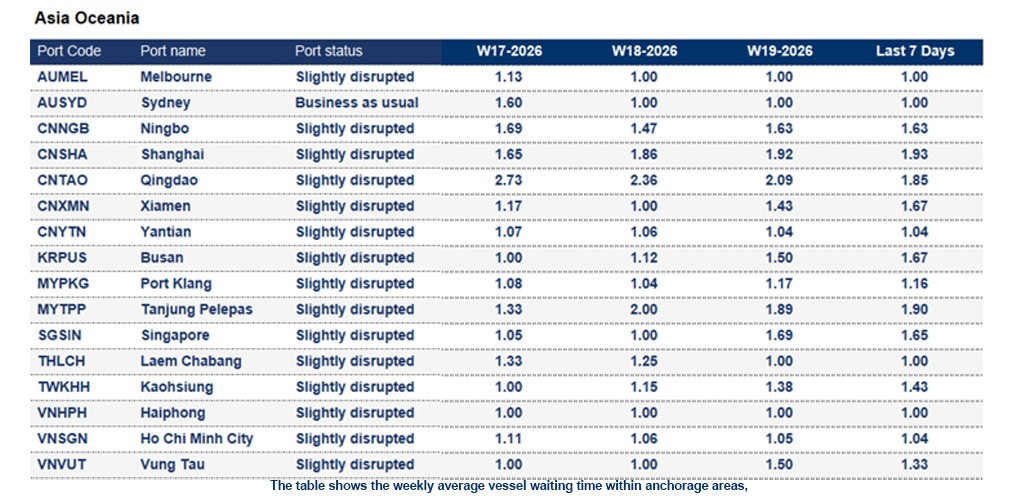
Asia Oceania
China
Nansha: The 7-day average vessel waiting time is around 1.02 days.
Ningbo: The 7-day average vessel waiting time is around 1.63 days this week. Yard occupancy is around 74–80%.
Shanghai: The 7-day average vessel waiting time is around 1.93 days. Yard occupancy is around 71–72% with waiting time up to 2.5 days due to concentrated vessel arrivals; the YGS12 terminal reports around 1.5 days waiting.
Xiamen: The 7-day average vessel waiting time is around 1.67 days. Port experienced a short closure due to traffic control last week.
Indonesia
Jakarta: The 7-day average vessel waiting time is around 1.5 days.
Semarang: The 7-day average vessel waiting time is around 3.0 days. The port is severely congested.
Surabaya: The 7-day average vessel waiting time is around 1.21 days.
Japan
Yokohama: The 7-day average vessel waiting time is around 1.5 days. Congestion improved due to reduced vessel calls during the holiday period with lower activity levels.
Malaysia
Port Klang: The 7-day average vessel waiting time is around 1.16 days. Yard density is around 70–75% with stable productivity and waiting times; overall, a healthy operational situation.
Tanjung Pelepas: The 7-day average vessel waiting time is around 1.9 days. Congestion remains dynamic, with multiple berth blockages due to crane installation, dredging and barge activities; waiting time expected to increase.
New Zealand
Tauranga: The 7-day average vessel waiting time is around 2.0 days. Yard utilisation around 91–93% with high reefer volumes; despite pressure, productivity remains strong and operations stable.
Philippines
Manila: The 7-day average vessel waiting time is around 2.79 days. Overall, the situation has stabilised, but heavy berth congestion persists, with delays generally exceeding 3 days for off-window vessels.
Singapore
Singapore: The 7-day average vessel waiting time is around 1.65 days. Port remains busy.
South Korea
Busan: The 7-day average vessel waiting time is around 1.67 days. Yard density is around 82% with minor berth congestion.
Vietnam
Haiphong: The 7-day average vessel waiting time is around 1 day. Terminals report steady operations with yard utilisation around 60–70% and no major congestion.
Ho Chi Minh City: The 7-day average vessel waiting time is around 1.04 days. Cat Lai terminal reports yard utilisation around 90–95%, with a general waiting time of 1–1.5 days and slight congestion.
Vung Tau: The 7-day average vessel waiting time is around 1.33 days. Terminal reports stable conditions, with yard utilisation around 80–85%.
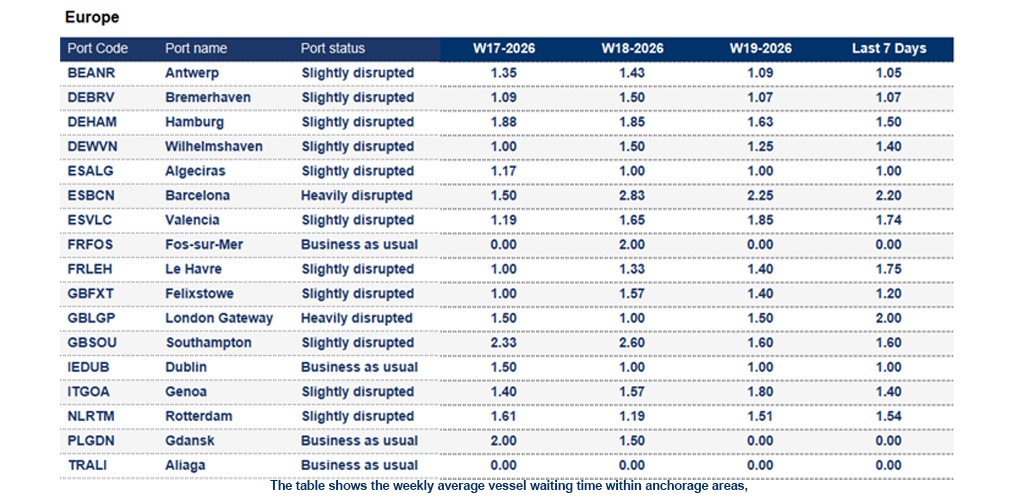
Europe
Belgium
Antwerp: The 7-day average vessel waiting time is around 1.05 days. Yard utilisation around 88–90% with truck turnaround of 30–45 minutes; barge operations normal and labour availability stable; strike announced on 12 May with unclear impact. Demonstration on 12 May 2026 and planned rail strike on 13 May signal potential disruption across multiple sectors. Read more.
France
Le Havre: The 7-day average vessel waiting time is around 1.75 days. Yard capacity this week is around 50% with operations concentrated towards end of week; terminal gates closed on public holiday while cargo operations continue.
Germany
Bremerhaven: The 7-day average vessel waiting time is around 1.07 days. Yard utilisation is around 83% with a tight lineup due to upcoming holidays; the situation remains fragile, though labour is currently stable.
Hamburg: The 7-day average vessel waiting time is around 1.5 days.
- CTA reports yard utilisation at 77%, with a continuous mainliner lineup, cranes not fully operational, and feeder operations required between mainliners due to ongoing construction; congestion and vessel overlap are expected around the Pentecost period.
- CTH reports yard utilisation at 79%, with stable, smooth operations and a high vessel workload; next week’s lineup is under pressure due to labour shortages and delayed vessel arrivals, with conditions described as challenging but manageable.
Wilhelmshaven: The 7-day average vessel waiting time is around 1.4 days. Yard density around 90% with tight vessel lineup; operations strained by holiday schedules, labour shortages and high sick leave rates, with pressure expected to remain high.
Italy
Genoa: The 7-day average vessel waiting time is around 1.4 days. Following union assemblies at the Port of Genoa and a strike on 7 May, port operations may experience delays.
Gioia Tauro: A national strike by USB occurred on 7 May, disrupting operations at Livorno. Terminal activities are likely to experience subsequent delays.
Netherlands
Rotterdam: The 7-day average vessel waiting time is around 1.54 days.
- ECT reports yard stable at around 80% with reefer operations under pressure due to high discharge volumes; barge delays of 0–24 hours and feeder delays of 24–48 hours observed, while gang availability remains under control.
- MVII reports yard density at 90% with delays caused by late vessel arrival impacting second modality, though no operational challenges are reported; a scheduled terminal outage is planned.
- Delta II reports yard density at 43% with moves above schedule and service adjustments involving vessel discharging at ECT DDE with loading at Delta II and subsequent service diversion.
United Kingdom
London Gateway Port: The 7-day average vessel waiting time is around 2.0 days. Yard utilisation is around 55% dry and 42% reefer, with stable operations; berth planning includes gaps and a scheduled temporary IT outage.
Southampton: The 7-day average vessel waiting time is around 1.6 days. Smooth operations reported with yard utilisation around 61% dry and 65% reefer; vessels generally berth on arrival.
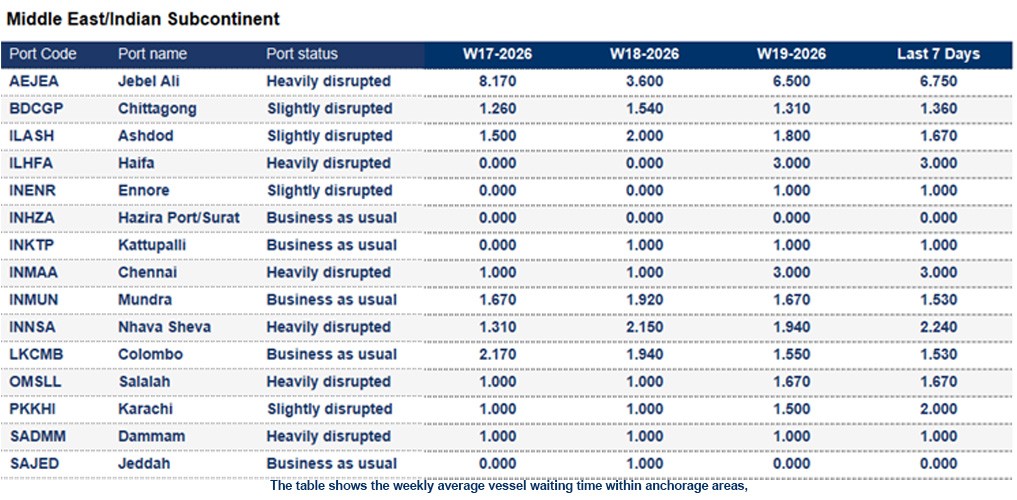
Indian Subcontinent and the Middle East
Bangladesh
Chittagong (Chattogram): The 7-day average vessel waiting time is around 1.36 days. Overall, the situation is steady, with minor berthing congestion of 1–2 days for geared and gearless vessels.
United Arab Emirates
Al-Fujairah: All port activities and business operations are proceeding effectively and without disruption. Due to the situation in the Strait of Hormuz, operations may be unstable.
Jebel Ali: The 7-day average vessel waiting time is around 6.75 days. Port operational, but vessel calls and cargo volumes reduced with reliance on land bridge and alternative routing. Due to the current situation in the Middle East, delays and disruptions are highly likely.
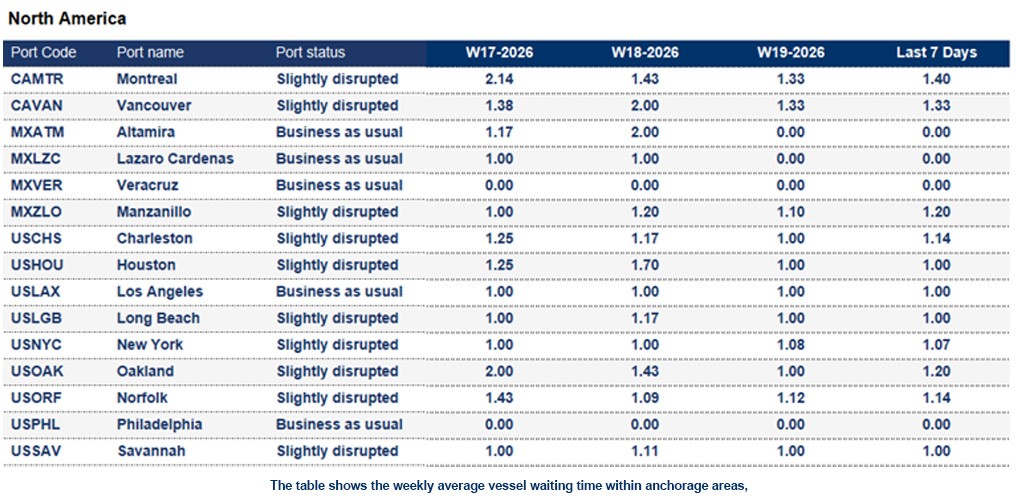
North America
Canada
Average import rail dwell time for Canadian cargo (Vessel arrival to departure rail ramp):
- Halifax: 8 days
- Montreal: 8 days
- Prince Rupert: 8 days
- Saint John: 7 days
- Vancouver: 7 days
Mexico
Manzanillo: The 7-day average vessel waiting time is around 1.2 days. At the ports of Manzanillo and Lázaro Cárdenas, adverse weather conditions may give rise to operational challenges. In addition, the availability of refrigerated equipment remains limited.
United States
Average import rail dwell time for American cargo (Vessel arrival to departure rail ramp):
- Halifax: 12 days
- Montreal: 9 days
- Prince Rupert: 8 days
- Vancouver: 6 days
- Saint-John: 8 days
- Charleston: 3 days
- Newark: 2 days
- Houston: 8 days
- Jacksonville: 3 days
- Los Angeles: 5 days
- Long Beach: 8 days
- New York: 5 days
- Miami: 1 day
- Oakland: 5 days
- Norfolk: 3 days
- Philadelphia: 10 days
- Savannah: 2 days
- Seattle: 4 days
- Tacoma: 4 days
Charleston: The 7-day average vessel waiting time is around 1.14 days.
Long Beach: The 7-day average vessel waiting time is around 1 day. Moderate yard congestion is observed during peak discharge periods.
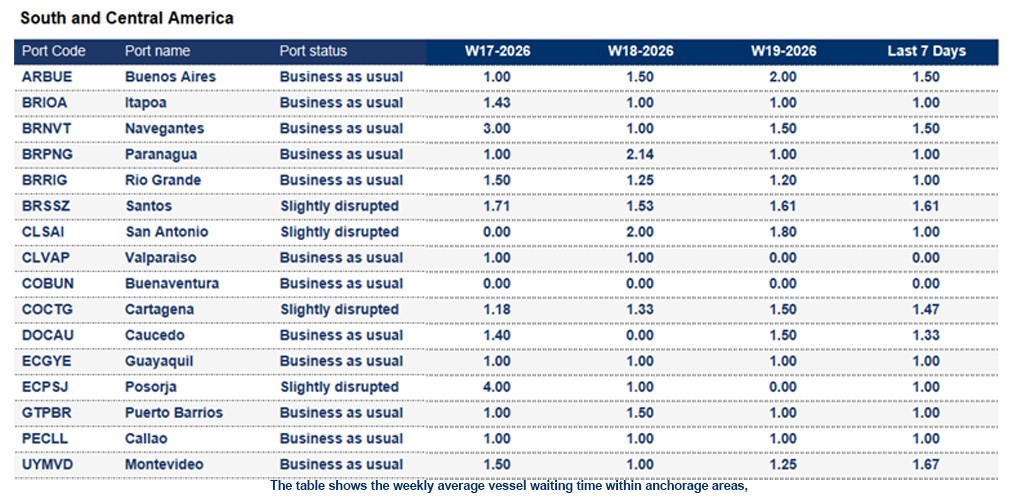
South and Central America
Bolivia
Nationwide road blockades disrupt Bolivian transport networks on 6 May. The Unified Confederation of Rural Workers of Bolivia initiates mass action, including road blockades and protests. Read more.
Brazil
Santos: The 7-day average vessel waiting time is around 1.61 days. Frequent channel manoeuvres continue to cause delays to ETBs and ETDs.