
- Stay ahead of supply chain disruptions and port congestion with Kuehne+Nagel’s weekly port operational update.
- Find out the latest vessel waiting times and status of ports in Africa, Asia Oceania, Europe, Middle East-Indian Subcontinent, North America, and South and Central America.
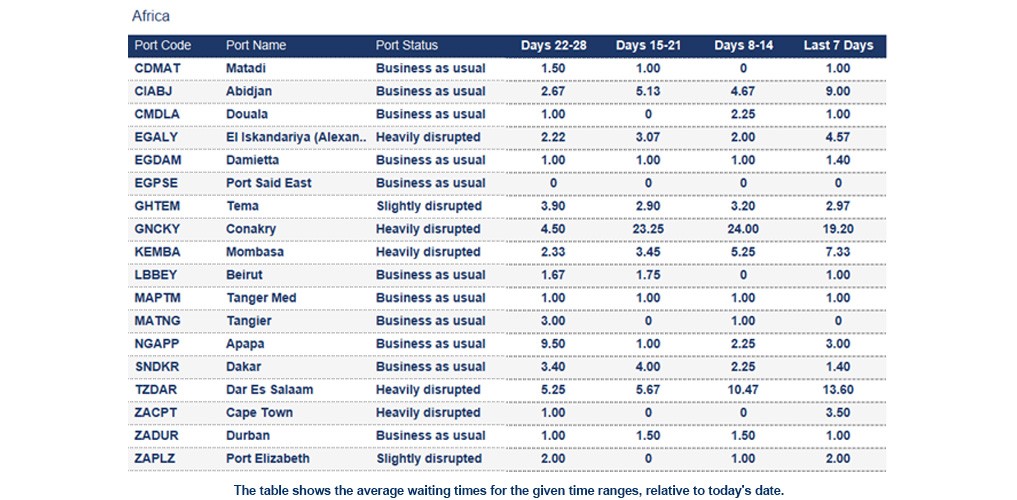
Africa
Algeria
Bejaia: The 7-day average vessel waiting time is around 5.5 days. The port was impacted by severe weather. Although conditions improved, a backlog persists.
Skikda: The 7-day average vessel waiting time is around 9.5 days.
Egypt
El Iskandariya (Alexandria): The 7-day average vessel waiting time is around 4.57 days.
Ghana
Tema: The 7-day average vessel waiting time is around 2.97 days. Severe congestion is being experienced, compounded by recurring crane outages. Non‑window vessels are subject to berth availability, and no ad‑hoc vessel calls are currently being accepted.
Guinea
Conakry: The 7-day average vessel waiting time is around 19.2 days. This is primarily driven by severe congestion and sub‑optimal terminal performance.
Ivory Coast
Abidjan: The 7-day average vessel waiting time is around 9 days. The terminal is slightly congested.
Kenya
Mombasa: The 7-day average vessel waiting time is around 7.33 days. The terminal is experiencing prolonged congestion and reduced productivity due to equipment shortages. Berth delays are further exacerbated by vessel bunching resulting from off‑window arrivals.
Morocco
Casablanca: The 7-day average vessel waiting time is around 5.43 days. The yard is at 90%.
South Africa
Cape Town: The 7-day average vessel waiting time is around 3.5 days. The port is impacted by strong winds.
Tanzania
Dar Es Salaam: The 7-day average vessel waiting time is around 13.6 days. DPW Terminal is facing severe delays of up to 8 days due to berth sequence, gate and road congestion.
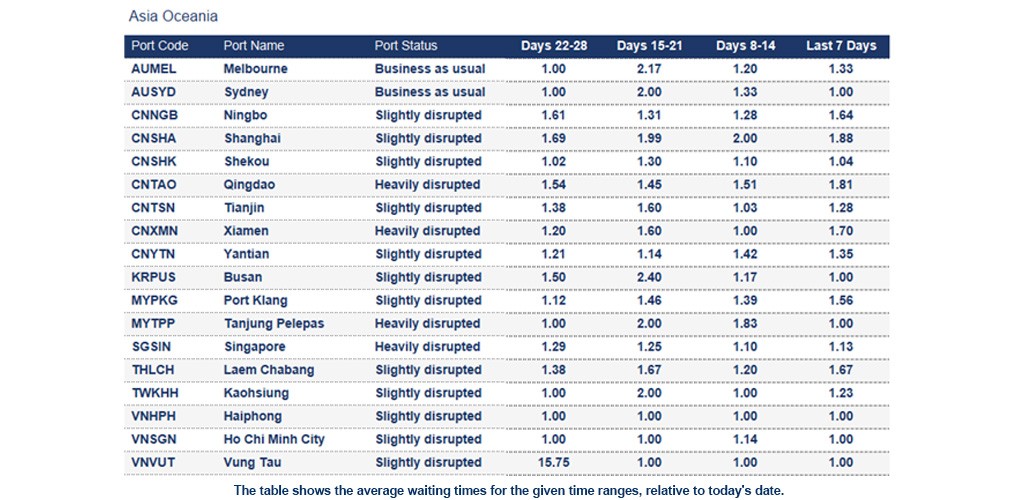
Asia Oceania
China
Dense fog caused disruption in Qingdao, Shanghai Tianjin and Xiamen beginning of week 13.
Yantian: The 7-day average vessel waiting time is around 1.35 days. Yantian Port is expected to face increased congestion for mega vessels with an LOA of 400 metres due to crane relocation works between Berths 10 and 13. The project is scheduled to conclude by mid‑April. Berth waiting times are estimated at 1 to 2 days for 400m vessels and 0.5 to 1 day for vessels under 366m LOA.
Malaysia
Tanjung Pelepas: The 7-day average vessel waiting time is around 1 day. Following Ramadan, limited terminal resources until 26 March resulted in reduced operational productivity. Heavy berth congestion persisted during Week 13. Berth 4 (approximately 150 metres) will be closed in Weeks 15–16 for new quay crane commissioning, while Berth 1 will remain unavailable until the end of April due to RTG disposal operations.
New Zealand
Severe weather disrupted operations at the Port of Tauranga after strong winds on Thursday, 26 March. Labour and crane crews were placed on standby, and vessel cargo operations were suspended. Winds exceeded forecasts and are expected to persist into Friday, delaying container exchanges. Operations are planned to resume Friday afternoon, subject to weather, amid a wider Bay of Plenty storm bringing heavy rain, swells and flood risk. Read more here
Philippines
Manila: The 7-day average vessel waiting time is around 2.89 days. Heavy berth congestion continues at Manila North, with off‑window vessels experiencing waiting times and delays of more than three days. Yard utilisation remains within normal levels at both terminals, with density estimated at approximately 70–80%.
Singapore
Singapore: The 7-day average vessel waiting time is around 1.13 days. PSA terminals remain busy, with most carriers experiencing berth wait times of approximately 1 to 1.5 days. Overall yard utilisation is currently high, with density levels around 80%, reflecting sustained pressure on terminal operations.
Europe
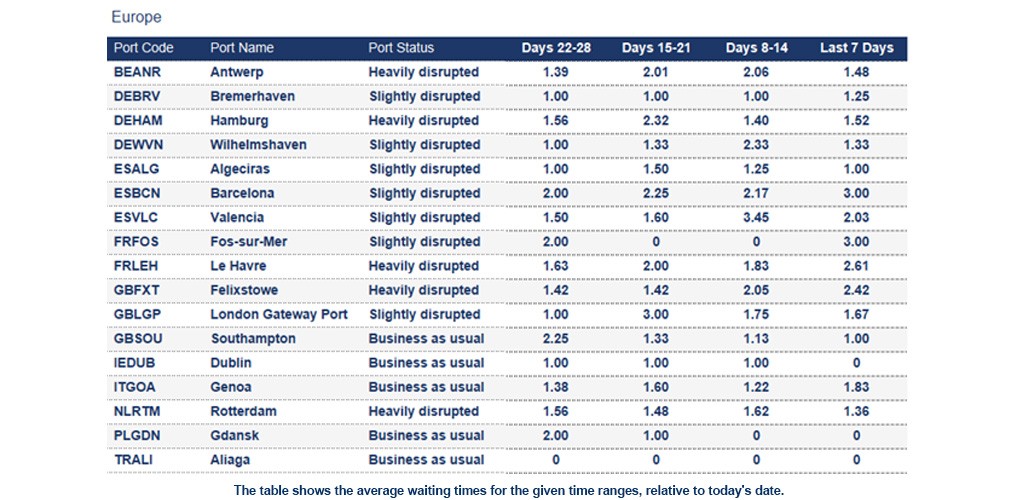
Belgium
Antwerp: The 7-day average vessel waiting time is around 1.48 days. Yard utilisation at Q869 stands at 81%, with reefer occupancy at 64% and empties at 54%. In contrast, Q913 remains at a critical utilisation level of 93%, with reefer occupancy at 85% and empties at 65%. As a result of the high yard density, the average truck turnaround time at Q913 is
France
Le Havre: The 7-day average vessel waiting time is around 2.61 days. Yard at a stable utilisation of 65% with Reefers at 75%. The port is impacted by vessel bunching.
Germany
Hamburg: The 7-day average vessel waiting time is around 1.52 days. CTA: Yard utilisation remains critical at an average of 89%, with the terminal close to capacity limits this week. Ongoing construction and yard maintenance continue to constrain space, while high import dwell times remain the main driver, according to CTA. Back‑to‑back mainliner calls persist with no schedule gaps. Labour availability may be strained over the weekend. The terminal is operating at its limit, with delays expected to build further, particularly ahead of the upcoming Easter closures. No improvement is anticipated before then. CTH: The yard is at 80%.
Netherlands
Rotterdam: The 7-day average vessel waiting time is around 1.36 days. The port was impacted by adverse winds with partial standstills from 24 - 25 March. ECT: Yard utilisation remains stable at approximately 80%. Barge delays range between 24 and 48 hours, with feeder delays peaking at up to 72 hours due to berth operations involving four mainliners simultaneously. Gang availability continues to improve. MVII: Yard utilisation stands at around 85%.
United Kingdom
London Gateway Port: The 7-day average vessel waiting time is around 1.67 days. Yard utilisation stands at 63% for dry cargo and 56% for reefers. Port productivity remains within expectations despite a busy berth line‑up, with vessels arriving as scheduled while delayed calls are cleared. Tide restrictions for deep‑draft vessels continue to cause delays. Empty container caps remain in place, and labour availability is stable with 13–14 gangs.
Middle East - Indian Subcontinent
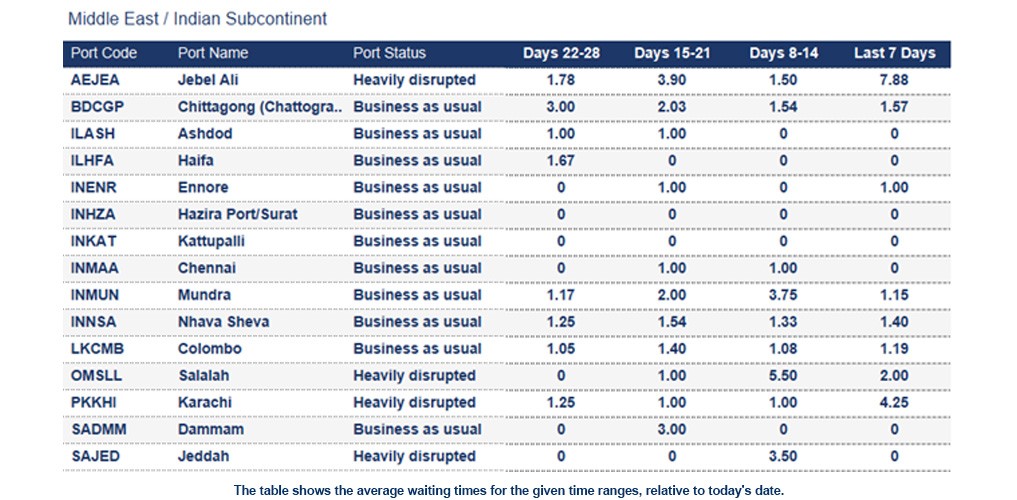
India
Due to the war in the Middle East, India, as a key transhipment hub, is handling higher container volumes, putting increasing pressure on port capacity. So far, Indian ports have continued to operate without formal congestion declarations, despite high yard utilisation at several terminals due to delayed transhipment evacuations and global schedule disruptions. Conditions remain largely stable, with only minor delays at select ports. While inland evacuation pressures persist, India remains comparatively resilient, with transhipment dwell management key to maintaining operational stability.
Middle East
Most Gulf ports continue operating normally despite sporadic security incidents. Several regional terminals reported small‑scale disruptions, though none have resulted in prolonged shutdowns.
Authorities across the Middle East remain on heightened alert, and logistics flows are being closely monitored as the situation evolves.
North America
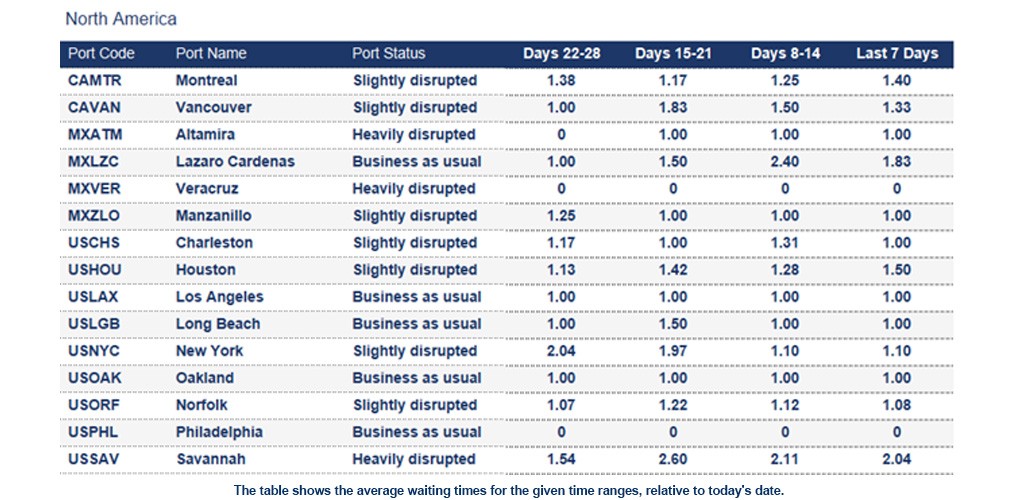 Canada
Average import rail dwell time for Canadian cargo (Vessel arrival to departure rail ramp):
- Halifax: 7 days
- Montreal: 7 days
- Prince Rupert: 8 days
- Saint John: 5 days
- Vancouver: 7 days
Mexico
Manzanillo: The 7-day average vessel waiting time is around 1.17 days. Rail platform assignment times for import shipments have increased from 72 to 96 hours. CONTECON and SSA Mexico terminals are experiencing minor delays following last week’s derailments in Cuyutlán, Colima. Increased volumes and revised Ferromex schedules are expected to further extend equipment assignment and loading lead times.
South and Central America
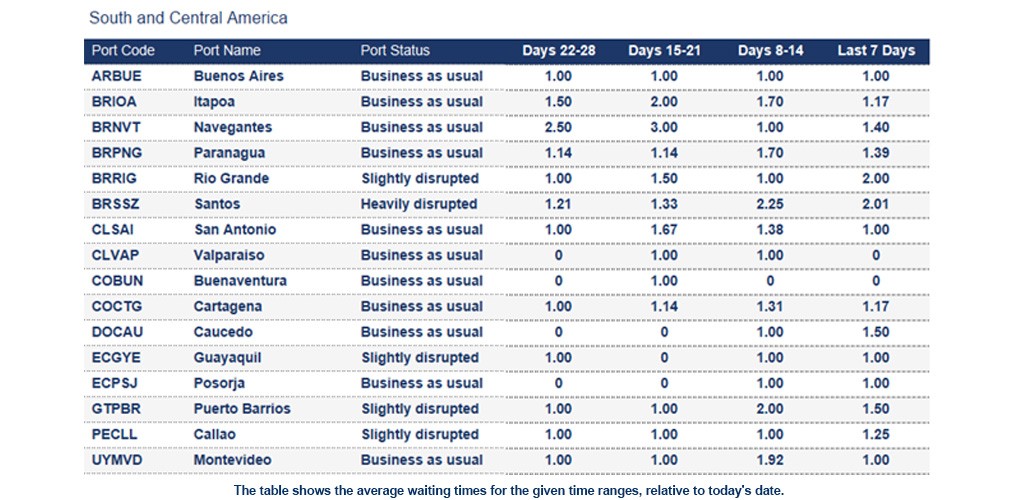
Ecuador
Guayaquil: The 7-day average vessel waiting time is around 1 day. The yard is at 70%. There is currently an equipment shortage.
Guatemala
Guatemala is experiencing widespread roadblocks on major highways, severely disrupting cargo movements and regional supply chains. The action follows recent fuel price increases, raising operating costs and reducing carrier margins. Businesses face delivery delays, higher freight costs, inventory shortages and declining distribution reliability.
Puerto Barrios: The 7-day average vessel waiting time is around 1.5 days. The yard is currently at 76%.
Puerto Santo Tomas de Castilla: The 7-day average vessel waiting time is around 1 day. The yard is currently at 81%.
Honduras
Puerto Cortes: The 7-day average vessel waiting time is around 1 day. The yard is at 80% utilisation.
Panama
Rodman: The 7-day average vessel waiting time is around 2.25 days. There are significant transshipment delays of up to 15 days at Rodman.
How Kuehne+Nagel estimates port disruption statuses
Seaexplorer has four port statuses that are estimated based mainly on the 7-day average vessel waiting time. Other factors include yard congestion, labour strikes, natural disasters or intermodal disruptions. Slightly different rules are applied to major ports, or ports that are hubs in their region, as they are typically more efficient.
- Business as usual means the port is currently operating without any significant disruption.
- Slightly disrupted is used if the 7-day average vessel waiting time exceeds 2 days.
- Heavily disrupted is used if the 7-day average vessel waiting time exceeds 4 days.
- Port closed is used when the port suspends operations due to a major disruptive event.
How Kuehne+Nagel calculates the 7-day average vessel waiting time
Mainline container vessels may spend a certain number of days waiting at designated anchorage areas before their scheduled port call.
To calculate the 7-day average waiting time, we consider the waiting days of these vessels, excluding:
- Waiting times for feeder vessels,
- Idle ships without an announced next port,
- Slow steamers heading toward the anchorage, but not actively waiting within the designated area
- Vessels passing through the anchorage area without intending to call at the port.
This rolling average is based on the last 7 days of data and is updated daily in seaexplorer. To find the latest waiting time for a port, enter the port name or code in the search bar and select the relevant option.
Stay Ahead, Stay Informed: Register for seaexplorer for the latest disruptions and vessel waiting times at global container ports.