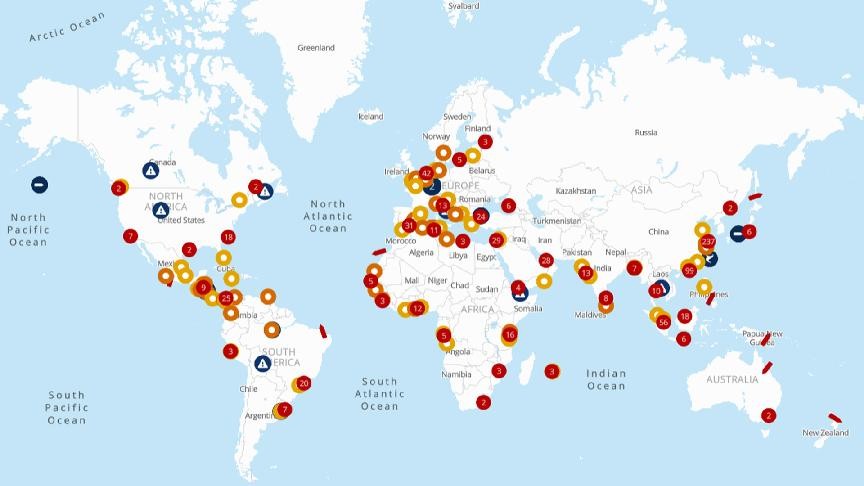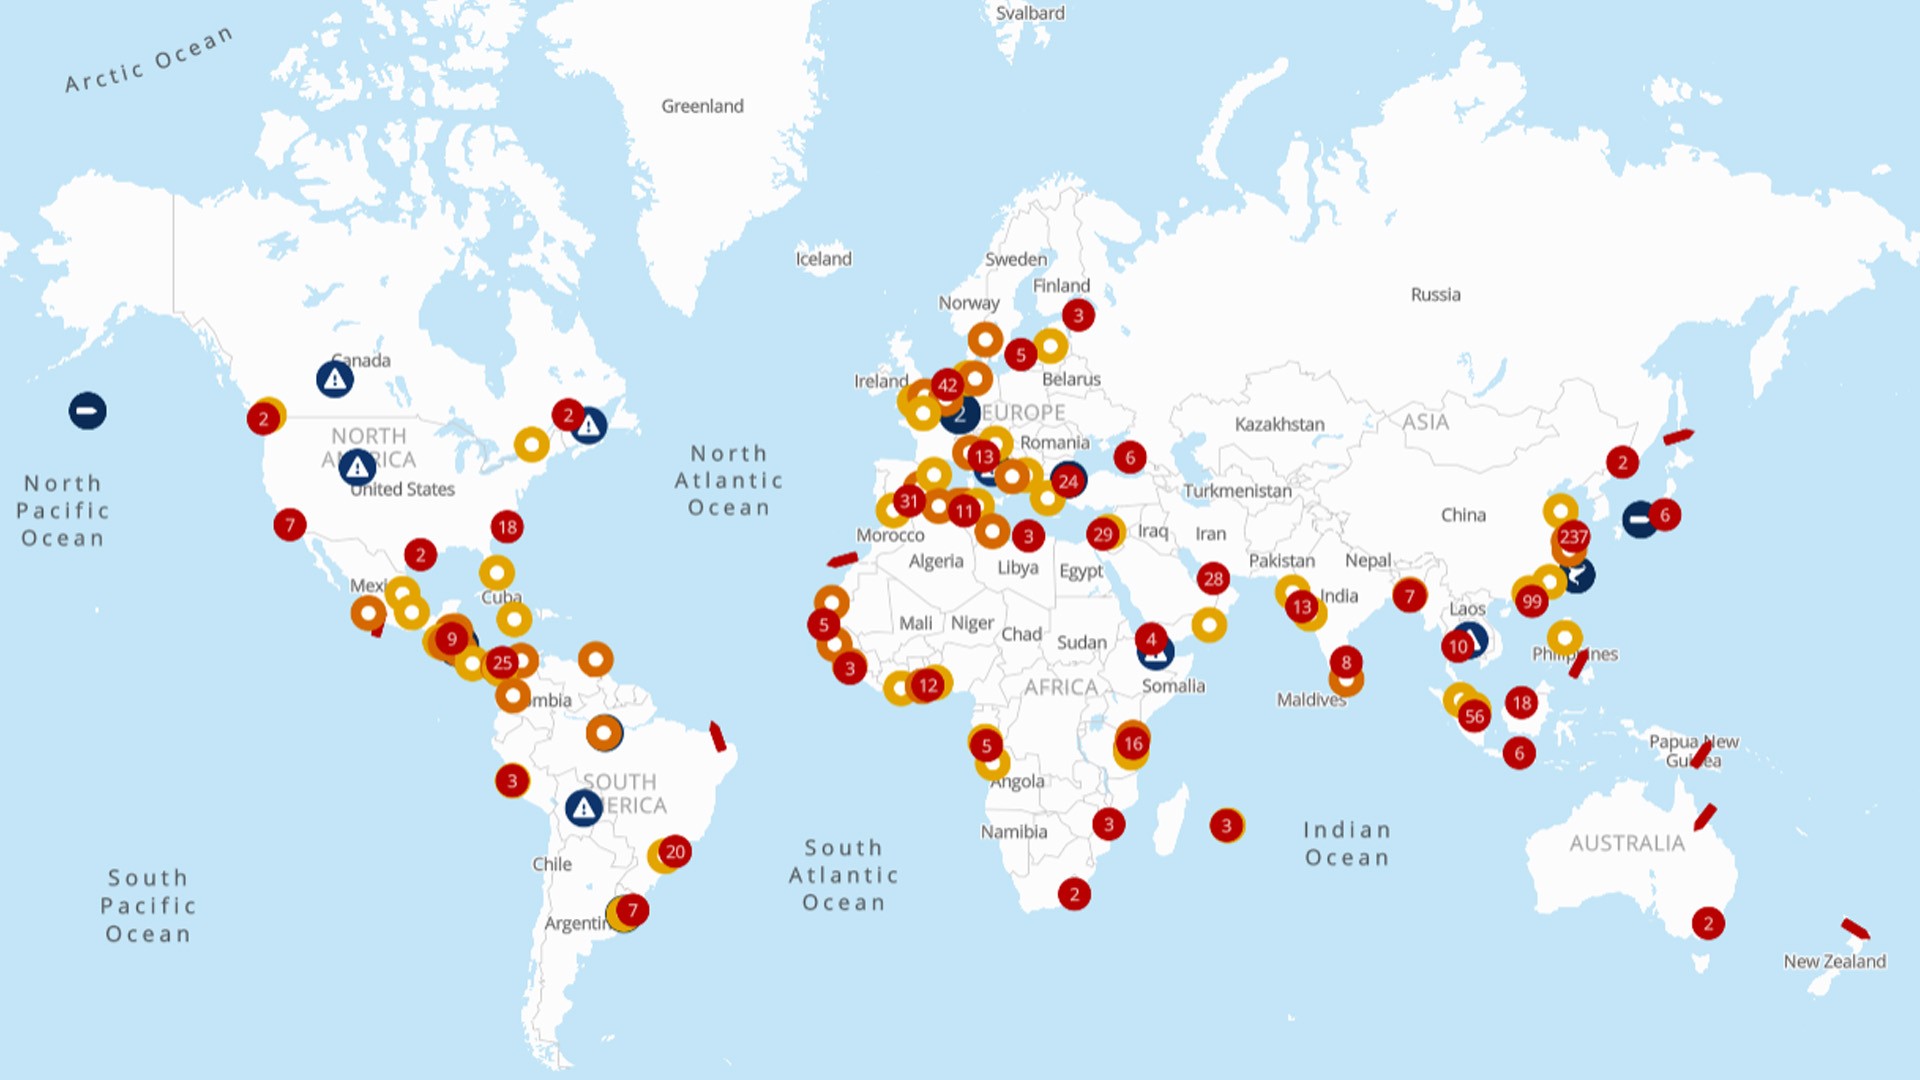

Stay ahead of supply chain disruptions and port congestion with Kuehne+Nagel’s weekly port operational update.
- Find out the latest vessel waiting times and status of ports in Africa, Asia Oceania, Europe, Middle East-Indian Subcontinent, North America, and South and Central America.
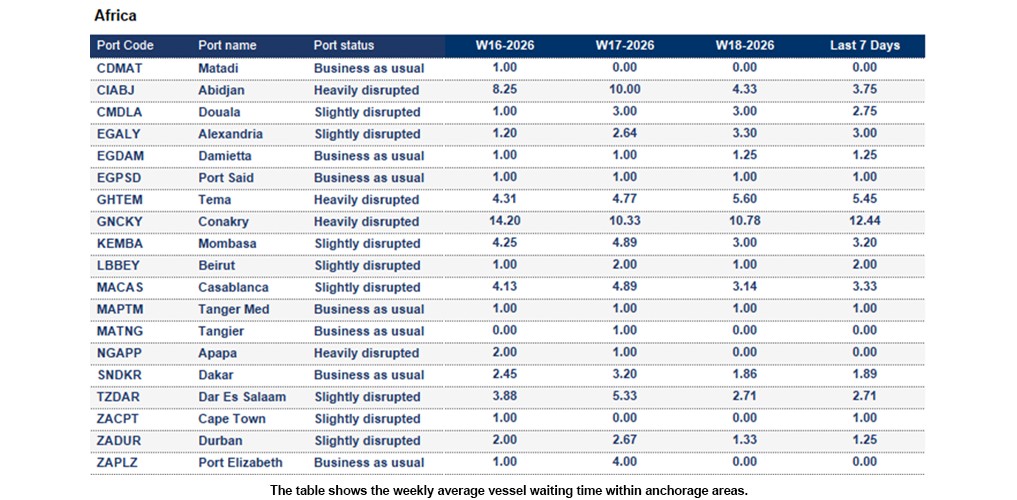
Africa
Benin
Cotonou: The 7-day average vessel waiting time is around 3.25 days.
Egypt
El Iskandariya (Alexandria): The 7-day average vessel waiting time is around 3.0 days.
Ghana
Tema: The 7-day average vessel waiting time is around 5.45 days. Yard utilisation remains high due to sustained volume growth and intermittent operational disruptions. Equipment downtime may further constrain productivity. In addition, Tema’s role as a key transhipment hub continues to place additional pressure on already congested terminal capacity.
Guinea
Conakry: The 7-day average vessel waiting time is around 12.44 days. Severe congestion persists, with prolonged vessel waiting times, limited dry and reefer storage capacity, and a shortage of empty containers continuing to pose significant constraints. While the introduction of 24/7 truck circulation has provided some relief, congestion remains unresolved and is expected to worsen with the onset of the rainy season, with deteriorating road and inland conditions.
Kenya
Mombasa: The 7-day average vessel waiting time is around 3.2 days. The terminal is experiencing prolonged congestion and reduced productivity due to equipment shortages. Berth delays are further exacerbated by vessel bunching resulting from off‑window arrivals.
Mozambique
Beira: The 7-day average vessel waiting time is around 4.67 days. Intermittent wind gusts and rainfall are forecast to persist for the remainder of the week.
Nigeria
Apapa: The 7-day average vessel waiting time is around 2.0 days. Persistent congestion continues to cause significant delays and operational slowdowns. Inefficient evacuation of import containers is exacerbating yard congestion, leading to a growing build‑up of empty containers. To support yard capacity management, restrictions on empty returns and intermittent terminal gate closures may be implemented.
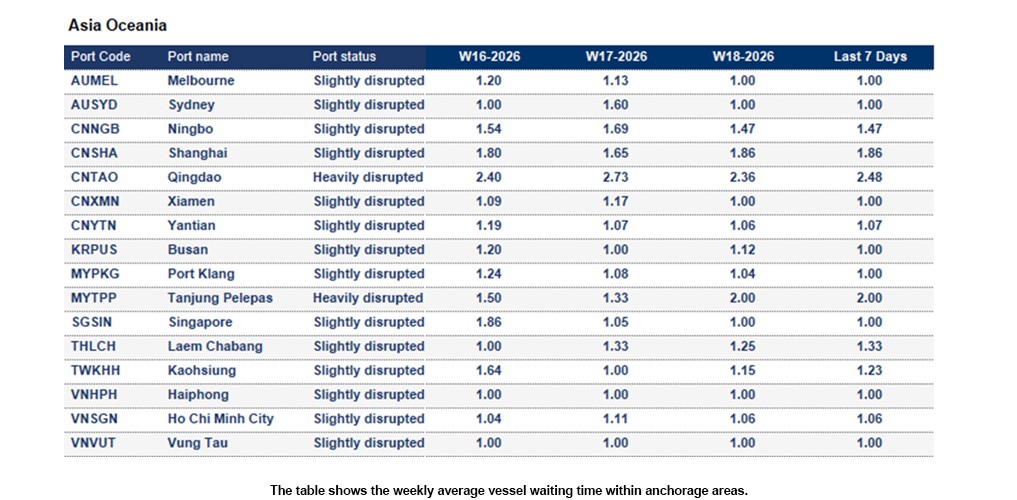
Asia Oceania
China
Ningbo: The 7-day average vessel waiting time is around 1.47 days. Yard occupancy remains elevated, with utilisation around 75% at main terminals and approximately 71% at other facilities. Reefer utilisation is high, reaching up to 82% at key terminals. A cargo rush is ongoing ahead of the Labour Day holiday period (1–5 May), increasing pressure on terminal operations. Dredging works at selected terminals are ongoing and are expected to be completed by 7 May.
Qingdao: The 7-day average vessel waiting time is around 2.48 days. The port was closed for approximately 3.5 hours on 27 April due to strong winds. It remains under severe congestion, with vessel waiting times close to four days, although conditions are showing gradual improvement. At QQCT, gantry crane upgrades are underway: two cranes have been shifted from Berth 83 to Berth 78, and two new gantry cranes were installed between 24 and 28 April. A further two cranes at Berth 78 are scheduled for removal and sale in early May, with an estimated operation duration of around three days.
Shanghai: The 7-day average vessel waiting time is around 1.86 days. Due to strong winds, WGQ pilot boat operations were temporarily adjusted, with the vessel repositioned within the channel to continue operations from 09:30 on the 28th. Yard occupancy stands at approximately 69% at WGQ and 73% at YGS12. WGQ port waiting time has remained around two days this week. Average waiting time at YGS12 is also around two days, mainly due to the concentrated arrival of mainline vessels.
Yantian: The 7-day average vessel waiting time is around 1.07 days. For mega vessels, Yantian experienced heavy congestion due to crane relocation works at Berths 10 and 13, involving the transfer of three cranes between the berths. The project was completed on 25 April, and congestion for larger vessels is expected to ease following completion.
Japan
Yokohama: The 7-day average vessel waiting time is around 1 day. Congestion worsened again last week.
Malaysia
Tanjung Pelepas: The 7-day average vessel waiting time is around 2.0 days. Berthing conditions remain dynamic. Week 18–19 outlook: Berth 4 will be blocked for around 14 days for new QC crane installation, with a 150m restriction during commissioning until Week 20, likely increasing waiting times at lower berths. Berth 10 has a 120m blockage due to dredging works. Berth 1 will be partially blocked from 29 April for RTG disposal, affecting around 200m of berth length.
Philippines
Manila: The 7-day average vessel waiting time is around 2.96 days. Overall conditions have stabilised; however, heavy berth congestion continues at Manila North, with off‑window vessels experiencing waiting times and delays of over three days. Yard utilisation at MICT remains high, at approximately 85–90%
Singapore
Singapore: The 7-day average vessel waiting time is around 1 day. Overall, PSA terminals remain busy, with vessel waiting times generally exceeding one day across all carriers. In Week 19, waiting times are expected to rise to around 1–1.5 days during the first half of the week due to heavy vessel bunching, before stabilising in the second half as berth demand eases. Yard utilisation remains healthy at approximately 70–75%.
Europe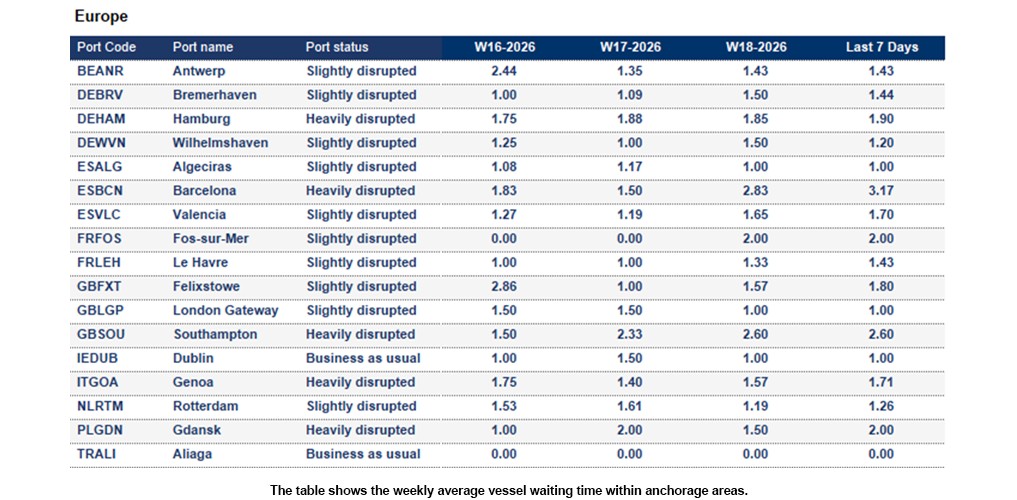
France
Le Havre: The 7-day average vessel waiting time is around 1.43 days. Yard at a stable utilisation of 65% with Reefers at 75%. The port is impacted by vessel bunching.
Germany
Bremerhaven: The 7-day average vessel waiting time is around 1.44 days. Yard utilisation is very high at 93%, remaining tight but manageable. The vessel line-up is under control.
Hamburg: The 7-day average vessel waiting time is around 1.9 days. Hamburg CTA remains under pressure, with yard utilisation peaking at 91% before easing over the weekend. Continuous mainliner line-up persists, while berth productivity is constrained by partially operational cranes and crane dismantling from WK19, with further restrictions expected in May. Berthing constraints, feeder windowing and the First of May closure will further strain the line-up. HHLA CTA Hamburg’s modernisation is on track. New remotely operated STS cranes will be installed between mid‑May and July 2026, with temporary traffic adjustments and potential increases in handling and waiting times during the works.
Wilhelmshaven: The 7-day average vessel waiting time is around 1.2 days. Yard utilisation stands at a healthy 62%, although delayed arrivals from CTA are increasing pressure on the vessel line-up. Shuttle operations are running as planned. Berthing windows and move counts will need adjustment due to reduced resources after the first of May closure.
Italy
Genoa: The 7-day average vessel waiting time is around 1.71 days. The Port of Genoa is expected to experience temporary operational disruptions on Tuesday, 5 May 2026, due to scheduled labour assemblies across multiple terminals between 09:00 and 14:00 local time. Terminal activities may be partially or fully suspended during these periods, impacting gate operations and overall productivity. Read more here
United Kingdom
London Gateway Port: The 7-day average vessel waiting time is around 1 day. Yard utilisation remains moderate, with dry cargo at 65% and reefer at 43%. Terminal operations are stable, supported by a berth plan showing available gaps. Labour availability is steady at 12–14 gangs, and no weather-related disruptions are anticipated.
Middle East - Indian Subcontinent
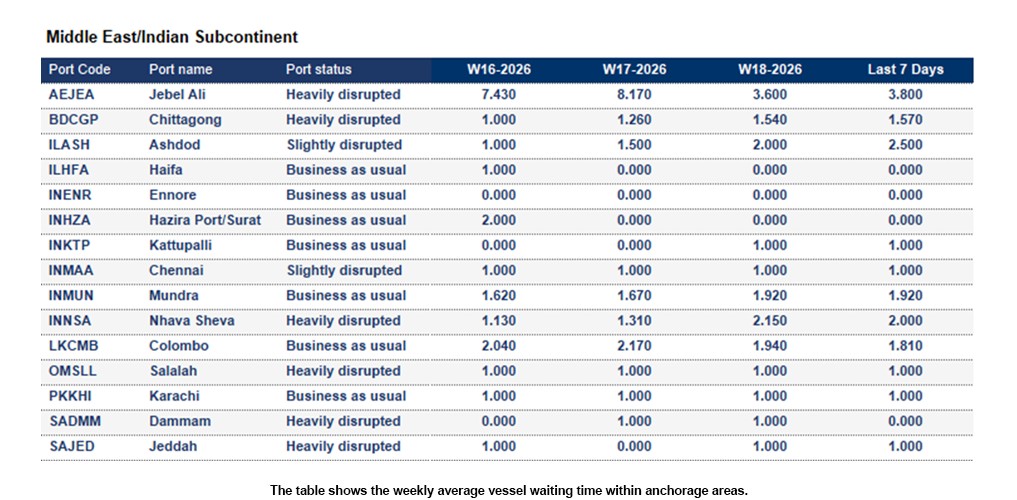
Middle East
Port conditions across the region remain stable, with all ports in the Persian Gulf reporting normal operations.
Bangladesh
Chittagong (Chattogram): The 7-day average vessel waiting time is around 1.57 days. Persistent heavy rainfall and flash flooding on Wednesday, 29 April, have impacted operations at Chittagong (Chattogram) Port. Flooding is affecting terminal and container yard activities, disrupting cargo movements at nearby CFS and off‑dock facilities. Export and import containers may face delays, with a heightened risk of water ingress in affected areas. Ongoing rainfall forecast until Saturday, 2 May, may prolong the disruption.
North America
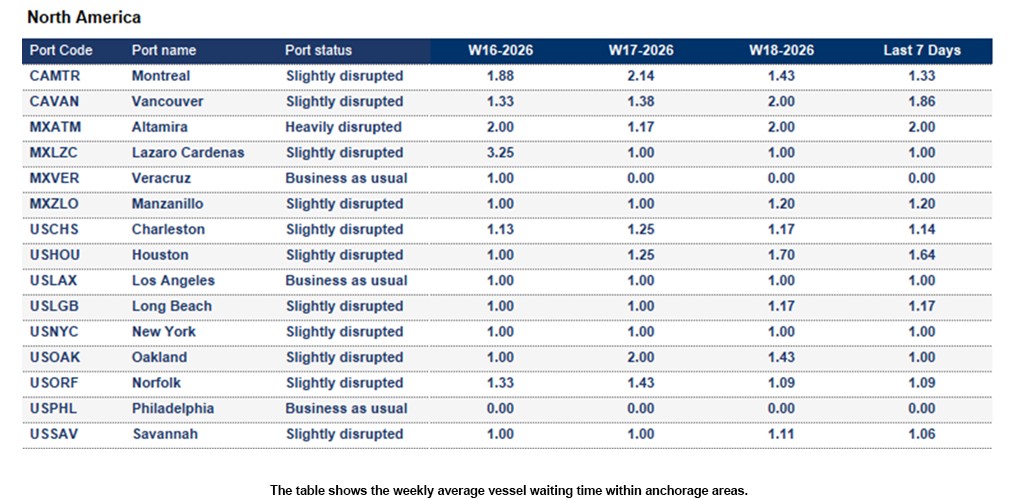
Canada
Average import rail dwell time for Canadian cargo (Vessel arrival to departure rail ramp):
- Halifax: 10 days
- Montreal: 7 days
- Prince Rupert: 8 days
- Saint John: 11 days
- Vancouver: 8 days
Vancouver: The 7-day average vessel waiting time is around 1.86 days. The average rail dwell time is around 8 days. Berth productivity remains stable; however, some anchorage queues persist, and rail and truck dwell times continue to remain elevated.
United States
Average import rail dwell time for American cargo (Vessel arrival to departure rail ramp):
- Halifax - 12 days
- Montreal - 9 days
- Prince Rupert - 9 days
- Vancouver - 6 days
- Saint-John - 8 days
- Charleston - 3 days
- Newark - 4 days
- Houston - 8 days
- Jacksonville - 3 days
- Los Angeles - 5 days
- Long Beach - 8 days
- New York - 5 days
- Miami - 1 day
- Oakland - 5 days
- Norfolk - 3 days
- Philadelphia - 10 days
- Savannah - 2 days
- Seattle - 4 days
- Tacoma - 4 days
New York: The 7-day average vessel waiting time is around 1 day. Inland constraints persist, with ongoing pressure on chassis availability at Elizabeth and Newark terminals, particularly during peak vessel discharge windows.
Savannah: The 7-day average vessel waiting time is around 1.06 days. Fluctuations in inland rail and trucking capacity are resulting in intermittent spikes in dwell times. As a result, terminals are increasingly relying on extended gate hours to manage yard density effectively.
South and Central America
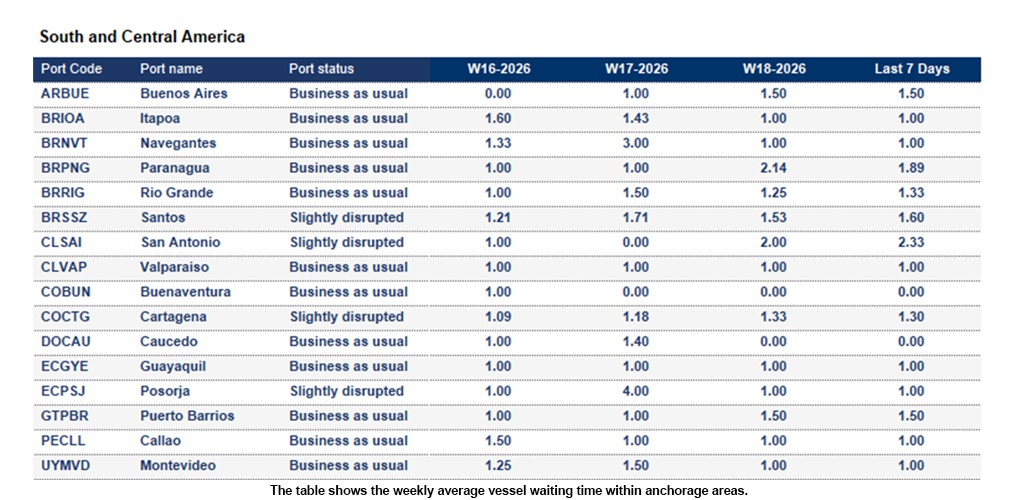
Brazil
Rio De Janeiro: The 7-day average vessel waiting time is around 2.0 days.
Chile
San Antonio: The 7-day average vessel waiting time is around 2.33 days.
Costa Rica
Caldera: The 7-day average vessel waiting time is around 2.33 days.
How Kuehne+Nagel estimates port disruption statuses
Seaexplorer has four port statuses that are estimated based mainly on the 7-day average vessel waiting time. Other factors include yard congestion, labour strikes, natural disasters or intermodal disruptions. Slightly different rules are applied to major ports, or ports that are hubs in their region, as they are typically more efficient.
- Business as usual means the port is currently operating without any significant disruption.
- Slightly disrupted is used if the 7-day average vessel waiting time exceeds 2 days.
- Heavily disrupted is used if the 7-day average vessel waiting time exceeds 4 days.
- Port closed is used when the port suspends operations due to a major disruptive event.
How Kuehne+Nagel calculates the 7-day average vessel waiting time
Mainline container vessels may spend a certain number of days waiting at designated anchorage areas before their scheduled port call.
To calculate the 7-day average waiting time, we consider the waiting days of these vessels, excluding:
- Waiting times for feeder vessels,
- Idle ships without an announced next port,
- Slow steamers heading toward the anchorage, but not actively waiting within the designated area
- Vessels passing through the anchorage area without intending to call at the port.
This rolling average is based on the last 7 days of data and is updated daily in seaexplorer. To find the latest waiting time for a port, enter the port name or code in the search bar and select the relevant option.
Stay Ahead, Stay Informed: Register for seaexplorer for the latest disruptions and vessel waiting times at global container ports.