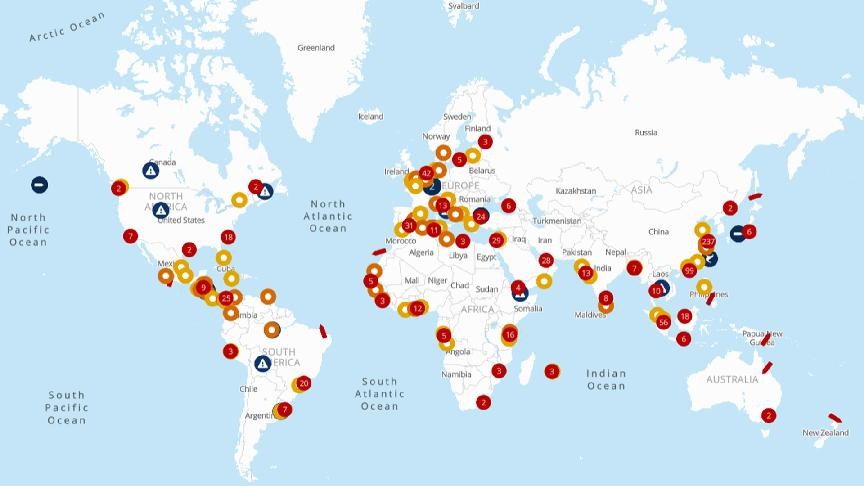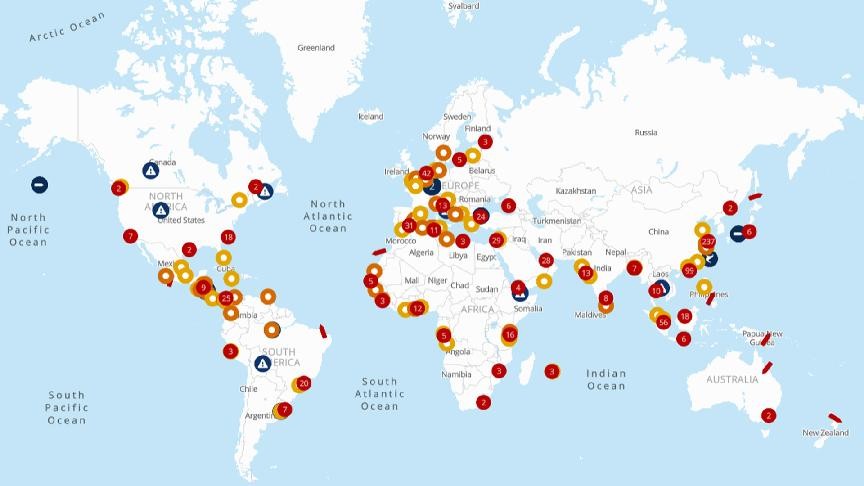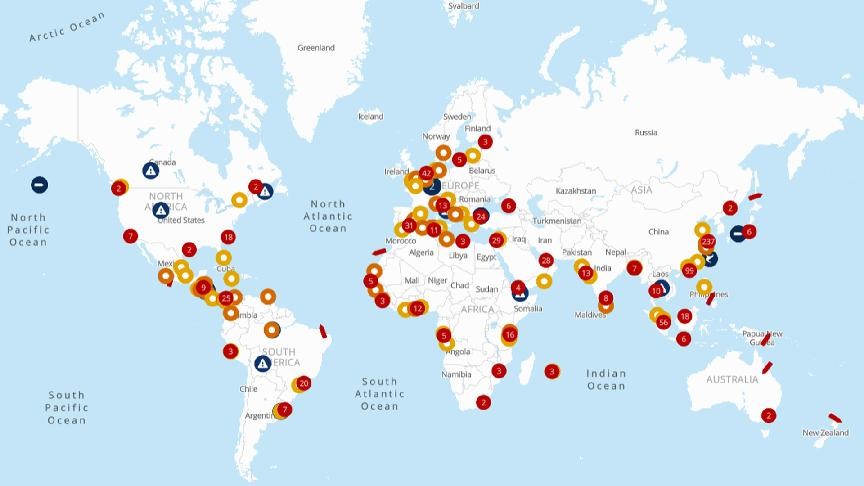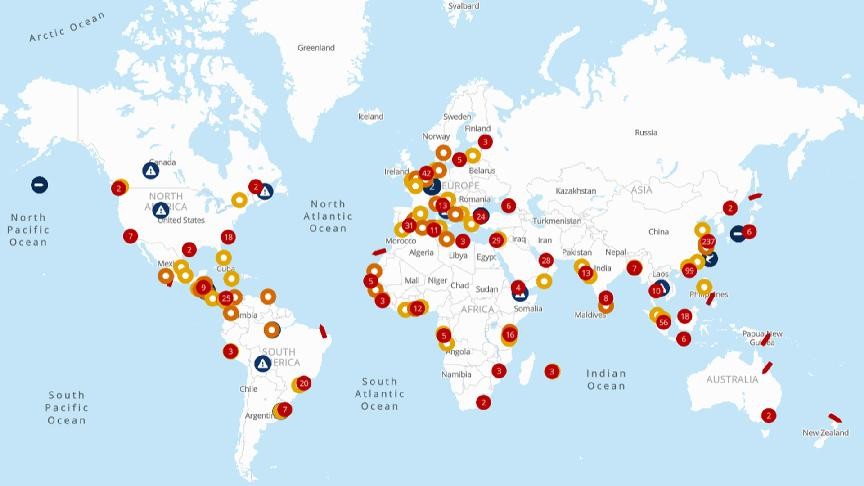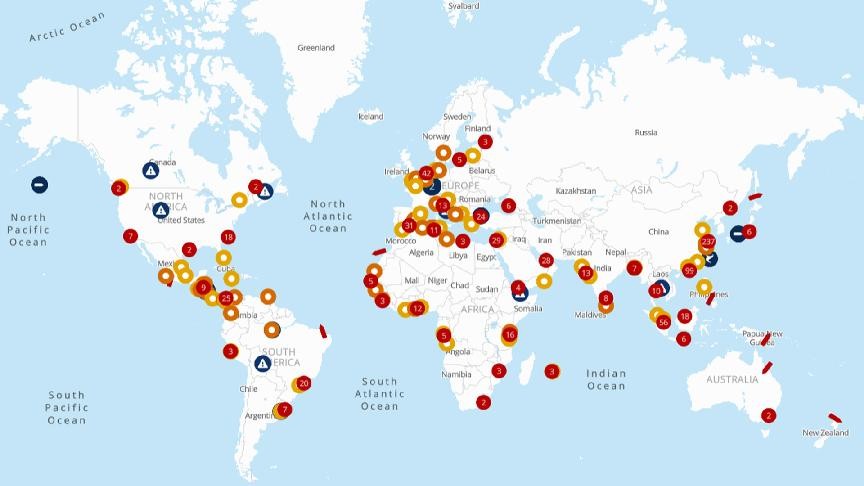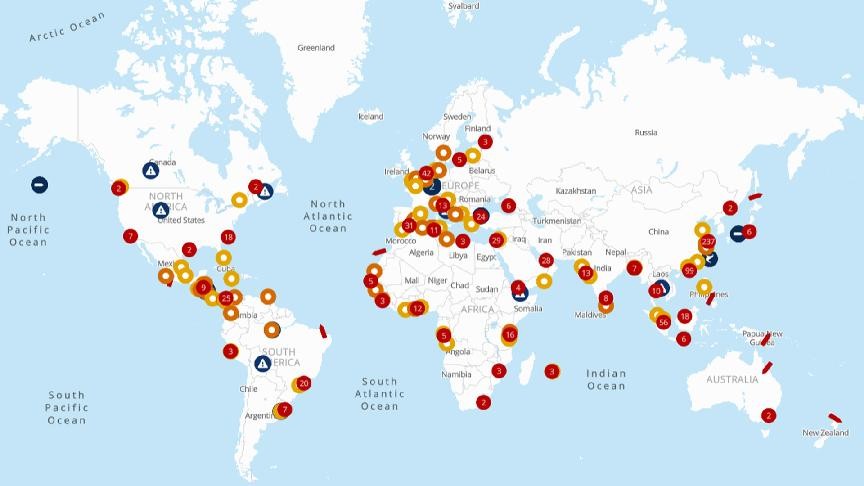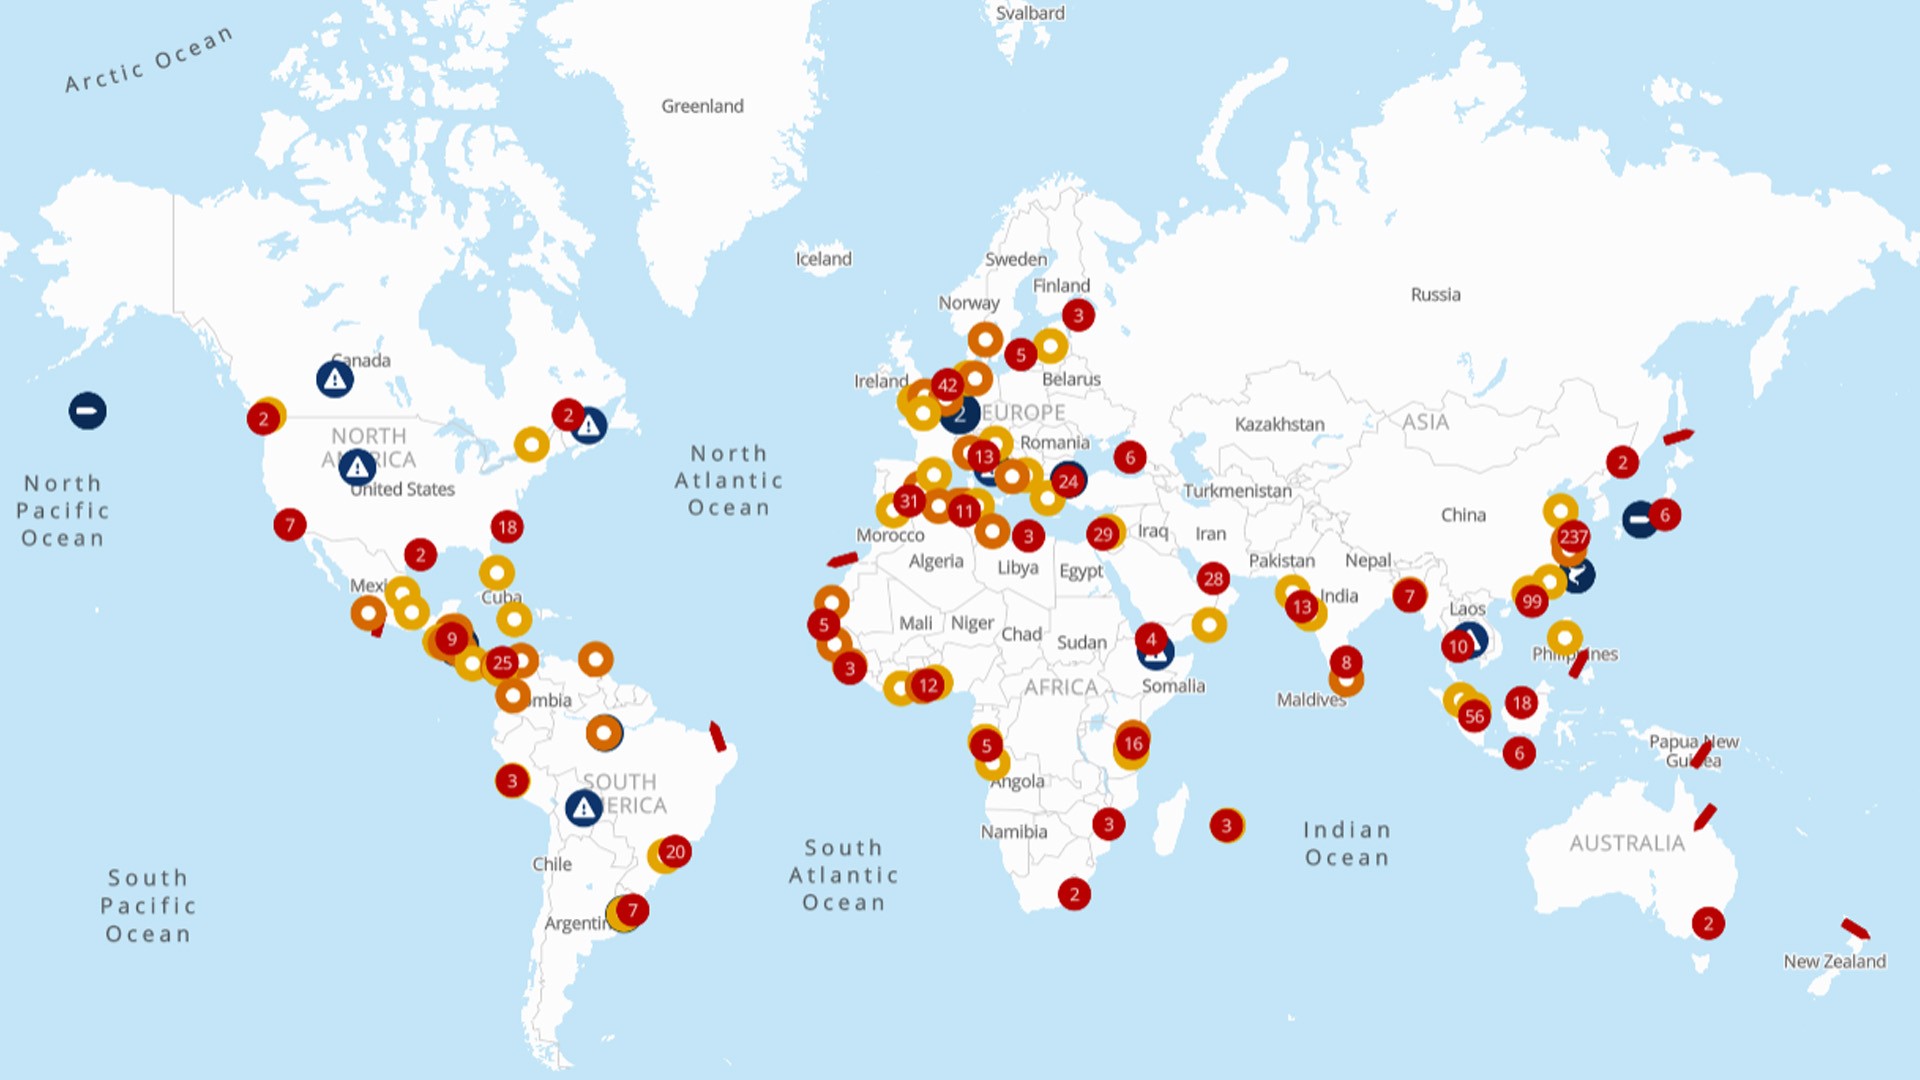

- Stay ahead of supply chain disruptions and port congestion with Kuehne+Nagel’s weekly port operational update
- Find out the latest vessel waiting times and status of ports in Africa, Asia Oceania, Europe, Middle East-Indian Subcontinent, North America, and South and Central America.
Africa
Guinea
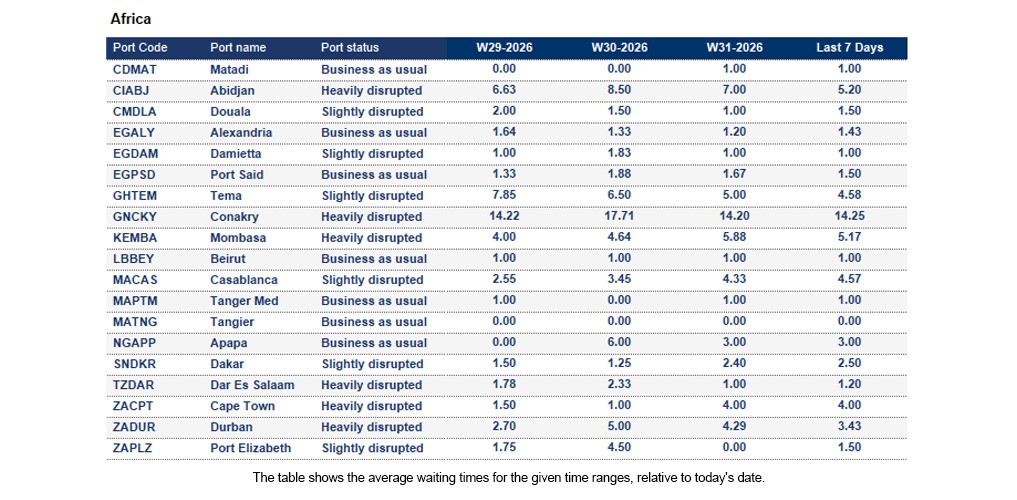
Conakry: The 7-day average vessel waiting time is around 14.25 days. Conakry Port remains congested, with both dry and reefer container storage capacity under significant pressure. The 24/7 truck circulation initiative has improved flows but has not cleared the backlog. The 40-ton legal weight limit remains in effect, and the rainy season is expected to further affect inland movements. The Conakry-Bamako corridor remains operational but is being closely monitored due to Mali’s fuel supply challenges.
Ivory Coast
Abidjan: The 7-day average vessel waiting time is around 5.20 days. Port congestion remains high due to strong regional trade volumes, vessel bunching, intermittent power outages, and infrastructure constraints. As the main gateway for Mali, Burkina Faso, and Niger, heavy import and transhipment demand continues to pressure container yards, while congestion at port gates and surrounding roads is impacting cargo flows and inland transport efficiency.
Kenya
Mombasa: The 7-day average vessel waiting time is around 5.17 days. Congestion remains a recurring challenge, driven by truck evacuation constraints, container imbalances, and growing cargo volumes. As a key hub connecting Asia, the Middle East, Europe, and East Africa, increasing throughput continues to place pressure on terminal and landside operations.
Mauritania
Nouakchott: Port authorities have taken control of warehouse facilities to stockpile essential commodities. Flat-rack container availability remains limited and requires advance booking. Truck availability remains limited outside Nouakchott, while the July-September rainy season is further affecting operations.
Senegal
Dakar: The port continues to experience moderate congestion due to an increase in volumes diverted from the Mali corridor. A queue of around 40 km formed at the Mali border on 21 July. Border crossings with Mali face waiting times exceeding 10 days.
Sierra Leone
Freetown: Freetown Port is experiencing moderate congestion linked to the WACS 2 inland container depot opening. Conditions are expected to improve as delayed vessels are processed. Road infrastructure remains challenging, and reliance on smaller transport operators continues to result in inconsistent service levels.
South Africa
Cape Town: The 7-day average vessel waiting time is around 4.0 days. Exceptionally high reefer demand driven by overlapping citrus and deciduous export seasons is placing significant pressure on capacity. Increased late-stack volumes are further constraining operations. The port remains the most constrained in the network, with a high risk of delays and cargo rollings expected in the coming weeks. The port is impacted by high winds and swells.
Durban: The 7-day average vessel waiting time is around 3.43 days. High berth congestion continues, with vessels arriving out of window and experiencing delays of 5–7 days. Strong citrus export volumes are driving high reefer plug utilisation, while landside congestion, booking slot shortages, system outages, and equipment failures are impacting truck turnaround times and container evacuation. DGT backlogs persist, increasing demurrage risk.
Port Elizabeth: The 7-day average vessel waiting time is around 1.5 days. Coega is experiencing operational challenges due to seasonal tidal restrictions and backlogs resulting from recent adverse weather conditions, impacting terminal productivity and cargo flows. The terminal is experiencing ongoing crane breakdowns, reducing productivity to approximately 12 moves per hour. Reefer volumes remain elevated but manageable. While the terminal is helping relieve pressure from Cape Town export flows, this is impacting operations in Port Elizabeth and Coega. Backlogs are expected to persist for the next three months.
Asia Oceania
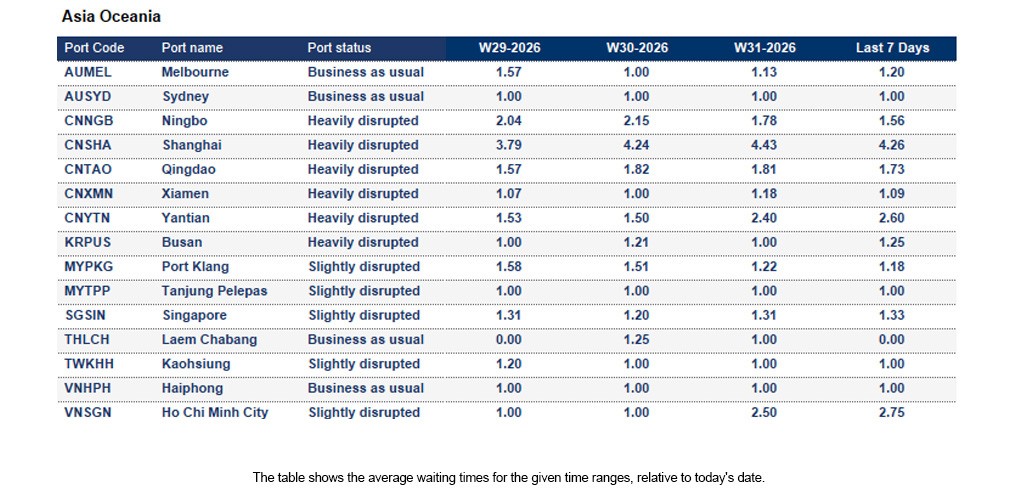
China
Nansha: The port was closed for 31 hours due to Typhoon Noul. After reopening, waiting times increased to 1–1.5 days, with some residual delays expected as operations stabilise.
Ningbo: The 7-day average vessel waiting time is around 1.56 days. MSICT is gradually recovering after several services were moved to other terminals, with current waiting times at 2–3 days. However, the port may face further challenges next week due to potential typhoon impacts.
Qingdao: The 7-day average vessel waiting time is around 1.73 days. The port closed for 20 hours due to dense fog last week. Operations are under pressure because of vessel bunching in the aftermath of Typhoon Noul. Maintenance dredging will start from 01/Aug in QQCTU. 1 berth will be blocked for around 2-3 weeks and will impact berth availability during the dredging period.
Shanghai: The 7-day average vessel waiting time is around 4.26 days. Congestion remains high, with waiting times around 7–8 days at WGQ2, 5 days at WGQ5, and 8 days at YGS12 due to concentrated mainline vessel arrivals and strong cargo volumes. Further typhoon-related challenges may occur next week.
Shekou: The port was closed for 50 hours due to Typhoon Noul, resulting in increased waiting times of 3–4 days after reopening. Congestion is expected to improve only gradually from Week 32 at the earliest.
Xiamen: The 7-day average vessel waiting time is around 1.09 days. The port was closed for 65.5 hours due to Typhoon Noul, which may result in ongoing vessel schedule disruptions and potential backlog recovery delays.
Yantian: The 7-day average vessel waiting time is around 2.60 days. The port was closed for 54 hours due to Typhoon Noul. Yard density remains around 90%, gate-in restrictions are in place at ETB minus 7 days, and waiting times have increased to around 5 days. Congestion is expected to improve only slowly from Week 32.
Japan
Yokohama: Average waiting time is around one day, mainly due to delayed vessel arrivals and vessel bunching in the second half of the week. Higher vessel call volumes are expected from Week 31 into Week 32.
Malaysia
Port Klang: The 7-day average vessel waiting time is around 1.18 days. In week 31, yard density maintained a level between 80% to 85%. The port will carry out maintenance dredging from 3 to 12 August. During this period, one high berth will be blocked, which is likely to impact operations for mega-sized vessels.
Tanjung Pelepas: The 7-day average vessel waiting time is around 1 day. Minor berth congestion reported for week 31.
Philippines
Manila: Berth congestion has improved, with off-window vessels now generally facing delays of around 2 days. However, the situation remains dynamic as delayed vessels from South China are expected to arrive progressively.
Singapore
Singapore: The 7-day average vessel waiting time is around 1.33 days. The port remained busy in week 31, with a slight impact on most carriers. However, berth demand has reportedly lowered compared to last week.
South Korea
Busan: The 7-day average vessel waiting time is around 1.25 days. BNCT is experiencing a high yard density of around 98%. Heavy berth congestion is expected in Week 32, potentially reaching a maximum of 2 days.
Vietnam
Ho Chi Minh City: The 7-day average vessel waiting time is around 2.75 days. Cat Lai remains steady, with general waiting times of around one day. Yard congestion is stable but elevated, with utilisation above 85%.
Europe
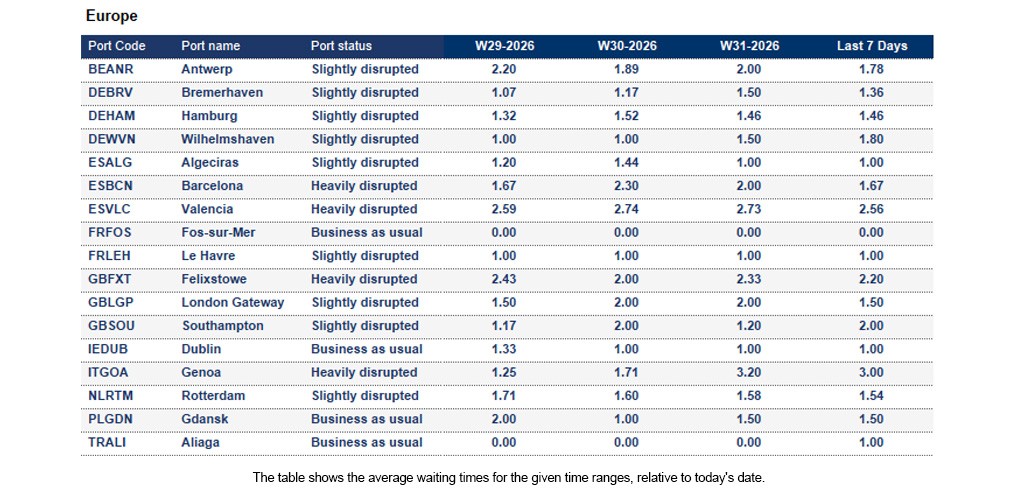
Belgium
Antwerp: The 7-day average vessel waiting time is around 1.78 days. Yard utilisation stands at 65% at Q869 and 92% at Q913. Truck turnaround is around 40–54 minutes, while heat breaks and reduced pilot availability due to holidays may affect vessel movements.
France
Le Havre: The 7-day average vessel waiting time is around 1 day. Yard occupancy has improved to around 50%, with reefer utilisation at 60%. Shuttle delays from Antwerp continue to affect schedules, while school holidays until early September may impact gang availability.
Germany
Bremerhaven: The 7-day average vessel waiting time is around 1.36 days. Yard occupancy is high at 91%, with capacity increasingly constrained, especially for IMO and OOG cargo. The vessel line-up remains broadly stable, but holiday-related labour constraints and ongoing vessel delays may affect operations.
Hamburg: The 7-day average vessel waiting time is around 1.46 days. High temperatures are expected to hit Hamburg this week.
- The CTA terminal is still facing congestion. Hapag-Lloyd reports an impact on waiting times for vessels. Labour at the terminal is also under pressure due to the school holiday season. As a result, the terminal lifted the overtime limit to allow for labour capacity. Some restrictions are expected in weeks 31 and 32 due to crane maintenance.
- At CTH, yard utilisation is normal, at around 78%. No major challenges were reported last week.
Wilhelmshaven: The 7-day average vessel waiting time is around 1.8 days. Yard density has increased to around 75%, driven by reduced loadings and schedule delays. The line-up remains fully constrained, with no recovery buffer, and further schedule or equipment disruptions could cause additional delays.
Netherlands
Rotterdam: The 7-day average vessel waiting time is around 1.54 days.
- At the ECT terminal, yard utilisation is reported to be under control with a level of around 60% on Friday, 31 July. There are barge and feeder delays between 24 and 48 hours.
- At the MVII terminal, yard utilisation is somewhat high at 90%.
- Meanwhile, yard utilisation at the DETLA II terminal is 30%, and operations are running smoothly.
United Kingdom
London Gateway Port: The 7-day average vessel waiting time is around 1.5 days. Yard occupancy remains healthy at 69% dry and 50% reefer. Dredging at Berth 4 continues to reduce quay length by 100 metres this week.
Southampton: The 7-day average vessel waiting time is around 2 days. Operations on the quay and land sides are running smoothly. Hapag-Lloyd reported an IT outage on 26 July, which delayed one of its vessels. Yard occupancy stands at 65% for dry cargo and 55% for reefers.
Indian Subcontinent and the Middle East
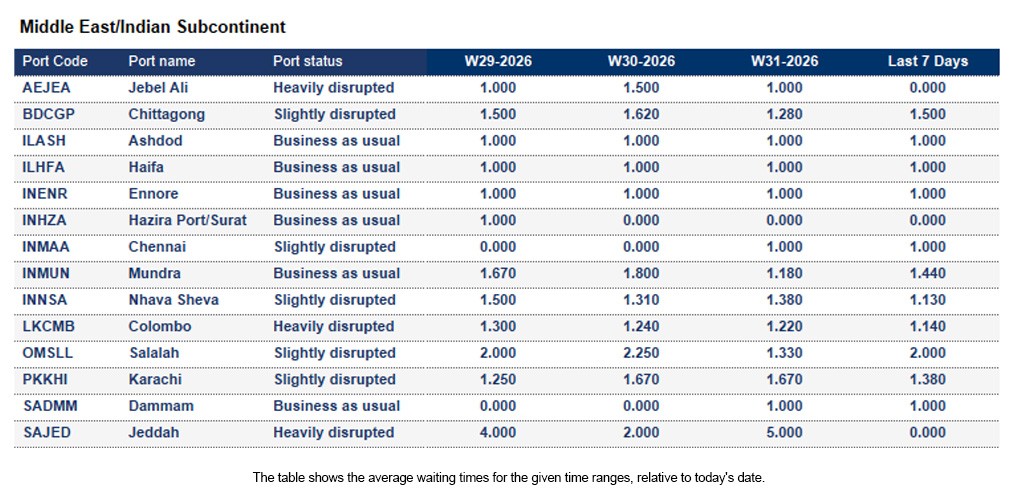
Bangladesh
Chittagong (Chattogram): The 7-day average vessel waiting time is around 1.5 days. Port operations are currently running normally despite Local Cautionary Signal No. 3 remaining in force due to adverse weather conditions in the Bay of Bengal. Heavy rain, thunderstorms and gusty winds of up to 60 km/h may temporarily impact vessel operations, berth movements, pilotage, terminal activities and cargo handling, with weather-related disruptions expected to continue over the coming days.
Oman
Salalah: The 7-day average vessel waiting time is around 2 days. Salalah is operating normally and has avoided major congestion issues. While carrier call frequency remains limited, port authorities are actively managing inbound and outbound cargo volumes. These measures are intended to maintain operational stability and prevent bottlenecks from developing.
Sohar: The 7-day average vessel waiting time is around 3.33 days. Sohar is currently experiencing severe congestion, with vessel berthing delays ranging from 7 to 14 days. The pressure on port infrastructure has led to longer waiting times for vessels. As regional cargo flows continue to shift, operational challenges at the port remain significant.
Saudi Arabia
Jeddah: Jeddah continues to experience severe congestion, with vessel berthing delays ranging between 10 and 21 days. Pressure extends across the entire logistics chain, affecting port operations, shipping lines, customs procedures, trucking capacity and freight forwarders. Additional restrictions introduced by Mawani have reduced the number of carriers willing to handle transit cargo, further limiting available options. While seaexplorer shows some vessels waiting outside the port, the AIS data of the exact port of call may be hidden for security reasons.
North America
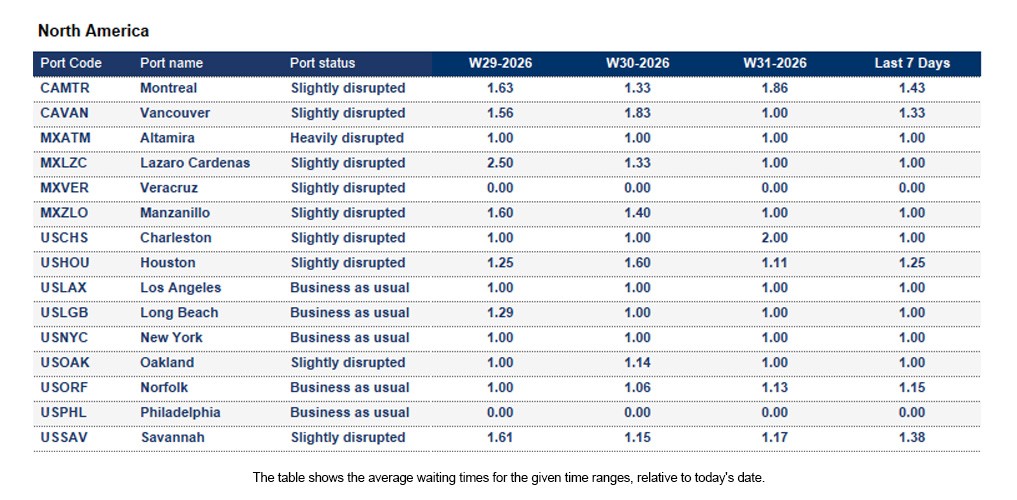
Canada
Average import rail dwell time for Canadian cargo (Vessel arrival to departure rail ramp):
- Halifax: 3 days
- Montreal: 7 days
- Prince Rupert: 6 days
- Saint John: 8 days
- Vancouver: 7 days
South and Central America
Argentina
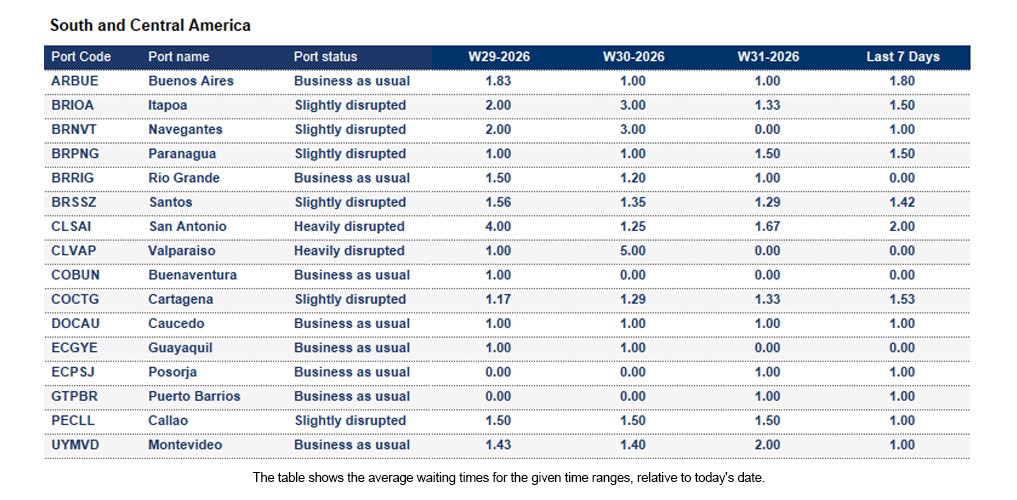
Maritime pilots in Argentina have commenced an indefinite labour strike on 3 August, protesting a decree that deregulates the country's pilotage and pilot services. The strike consequently prevented ships from entering, departing or transiting through ports, disrupting maritime operations nationwide. Currently, there is no clear date concerning the end of the strikes.
Brazil
Itapoa: The 7-day average vessel waiting time is around 1.5 days. The yard is currently operating at 72% capacity. The berth window at Itapoa is fully occupied, leaving no gaps between scheduled services. Vessels that arrive within their assigned berth window experience minimal waiting time, while those arriving outside the window may face significantly longer delays.
Manaus: River conditions in the Amazon region indicate that the dry season is likely to begin in October (week 41), which entails navigation restrictions impacting cargo movement around the Port of Manaus. Maersk expects operational impact occurring between weeks 43 and 47, and capacity restrictions between weeks 48 and 52 (December).
How Kuehne+Nagel estimates port disruption statuses
Seaexplorer has four port statuses that are estimated based mainly on the 7-day average vessel waiting time. Other factors include yard congestion, labour strikes, natural disasters or intermodal disruptions. Slightly different rules are applied to major ports, or ports that are hubs in their region, as they are typically more efficient.
- Business as usual means the port is currently operating without any significant disruption.
- Slightly disrupted is used if the 7-day average vessel waiting time exceeds 2 days.
- Heavily disrupted if the 7-day average vessel waiting time exceeds 4 days.
- Port closure is used when the port suspends operations due to a major disruptive event.
How Kuehne+Nagel calculates the 7-day average vessel waiting time
Mainline container vessels may spend a certain number of days waiting at designated anchorage areas before their scheduled port call. To calculate the 7-day average waiting time, we consider the waiting days of these vessels, excluding:
- Waiting times for feeder vessels,
- Idle ships without an announced next port,
- Slow steamers heading toward the anchorage, but not actively waiting within the designated area
- Vessels passing through the anchorage area without intending to call at the port.
This rolling average is based on the last 7 days of data and is updated daily in seaexplorer. To find the latest waiting time for a port, enter the port name or code in the search bar and select the relevant option.
Stay Ahead, Stay Informed: Register for seaexplorer for the latest disruptions and vessel waiting times at global container ports.