
- Stay ahead of supply chain disruptions and port congestion with Kuehne+Nagel’s weekly port operational update.
- Find out the latest vessel waiting times and status of ports in Africa, Asia Oceania, Europe, Middle East-Indian Subcontinent, North America, and South and Central America.
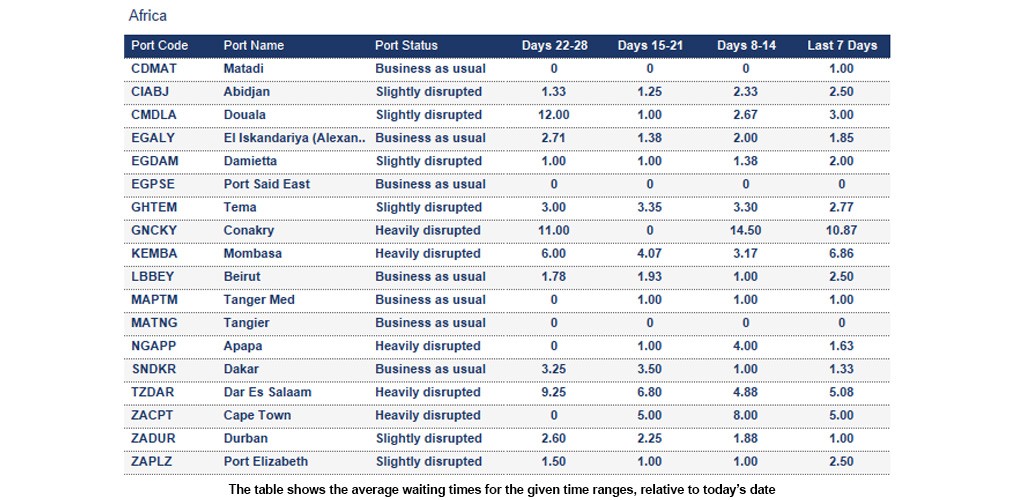
Africa
 Cameroon
Douala: Feeder waiting ~3 days mainly due to mainliner connections; yard strain persists. Expect schedule variability and delayed transhipment connections.
Ghana
Tema: The 7-day average vessel waiting time is around 2.77 days. Berthing delays of up to four days are currently being experienced at Tema port. The terminal is facing crane outages, resulting in significant operational constraints. Window vessels are encountering delays of up to 36 hours, while non-window vessels are handled subject to berth availability. The terminal is operating under strict pro-forma move guidelines.
Ivory Coast
Abidjan: The 7-day average vessel waiting time improved this week to around 2.5 days. Operational slowdowns are anticipated due to vessel line-up delays. Vessels arriving within the window can wait up to 24h.
Mozambique
Maputo: The 7-day average vessel waiting time is around 2 days. Intermittent periods of wind gusts and rainfall are forecast throughout the week.
Nigeria
Apapa and Tincan/Lagos: The 7-day average vessel waiting time is around 1.6 days and 3 days, respectively. Severe rainfall is forecast for the next weeks.
Republic of the Congo
Pointe Noire: The 7-day average vessel waiting time is around 7.48 days. Operations are normal overall; feeders can face up to ~3 days' delay primarily for mainliner connections.
South Africa
Cape Town: The 7-day average vessel waiting time is around 5 days. Strong winds have disrupted port operations, with terminal activities suspended due to wind-bound conditions. Significant delays are currently being experienced, especially at CTCT.
Durban: Operational challenges continue at Pier 1, resulting in extended waiting times. Hapag-Lloyd reports waiting times of up to ~4 days at Pier 1 and up to ~3 days at Pier 2.
Port Elizabeth: PECT: Service maintenance is planned to take place from 19 January through to the end of March 2026.
Asia Oceania
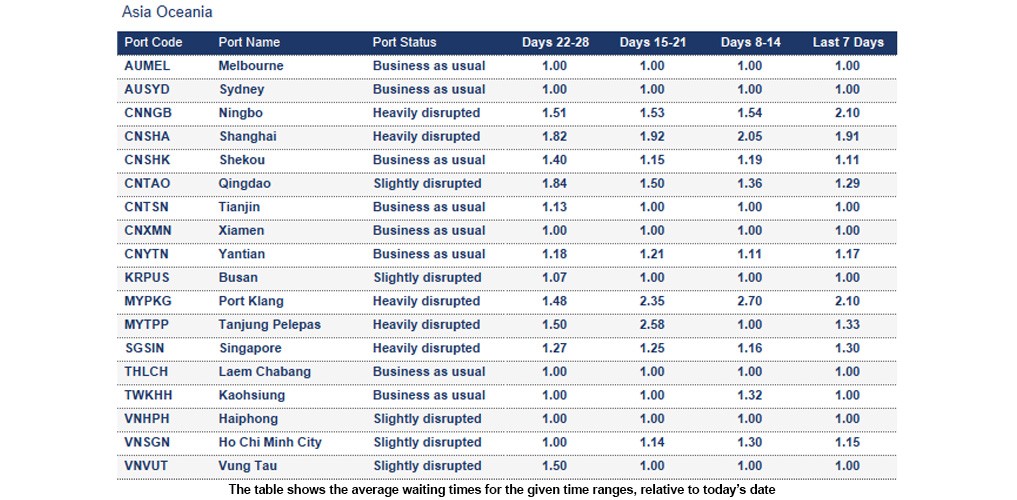
Surabaya: Surabaya Port is experiencing severe congestion due to heightened post-holiday activity and the forthcoming Chinese New Year and Eid holidays. Adverse weather is compounding operational challenges, causing extended delays, with current average berthing times reaching approximately two days.
Malaysia
Bintulu: 7-day average vessel waiting time around 4.33 days.
Europe
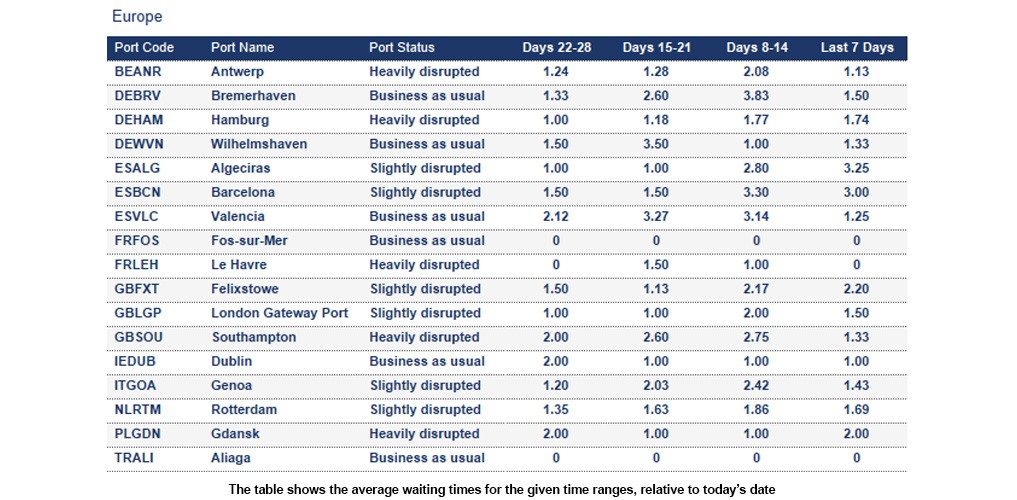
Belgium
Antwerp: The 7-day average vessel waiting time is around 1.13 days. Yard utilisation remains high at both Q913 and Q869, with elevated occupancy across dry, reefer, and empty stacks. Truck turnaround at Q913 is efficient at under 25–30 minutes, while Q869 averages 50–55 minutes. Labour availability is strong, with over 30 gangs on weekdays and 22–26 on weekends. Ongoing delays in Hamburg continue to impact the Antwerp line‑up.
France
Le Havre: The terminal was impacted by the severe winter weather in week 2. Yard ~50–55% (reefers ~45–50%); slight weather‑related delays with recovery within the week.
Germany
Bremerhaven (NTB): Yard ~80–85%; minor fog early week but delays recovered; operations near normal.
Hamburg: The 7-day average vessel waiting time is around 1.65 days. CTA, CTT and CTB have resumed normal operations and productivity. Yard utilisation remains high, nearing the upper 80% due to an imbalance between truck pickup and waterside discharge. Ice‑related delays mean all vessels are behind PF, with recovery expected late next week. Berths remain fully utilised, waiting times persist, labour is strengthening, and the outlook is positive.
Wilhelmshaven (CTW): Yard ~65–70%; minor fog early week, but delays recovered; stable operations.
Netherlands
Rotterdam: The 7-day average vessel waiting time is around 1.69 days.
- ECT operates at 78% yard utilisation with feeder delays up to 72 hours and barge delays up to 24 hours; Hamburg discharge is assessed case by case.
- MVII is at full capacity after storm‑related reductions, with barge delays of 24 hours and limited scope for Hamburg discharge.
- Delta II runs at 40% utilisation with 12–24‑hour delays and restricted reefer capacity. Overall performance across Rotterdam remains heavily weather‑dependent.
Poland
Gdansk: The 7-day average vessel waiting time is around 2 days. The port was affected by severe winter weather in week 2.
Réunion
Port de Pointe des Galets: Port is currently effected by winds and rain. The weather is forecast to remain until the end of the week.
United Kingdom
Felixstowe: The 7-day average vessel waiting time is around 2.2 days.
London Gateway Port: The 7-day average vessel waiting time is around 1.5 days. Yard occupancy remains stable with a notable reduction in empty stock. Weekly terminal planning is now aligned as delayed vessels begin arriving. Storm Goretti caused intermittent pilot‑station closures across southern UK ports, resulting in further vessel delays.
Southampton: The 7-day average vessel waiting time is around 1.33 days. The yard is at 97% for dry and 90% for reefers. The terminal is highly utilised.
Middle East - Indian Subcontinent
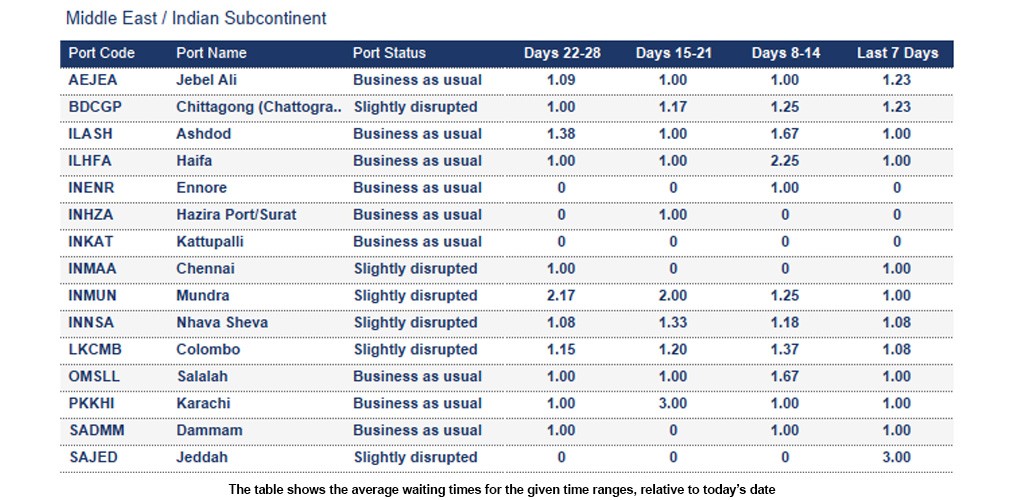
Bangladesh
Chittagong (Chattogram): The 7-day average vessel waiting time is around 1.23 days. The yard is at 66.6%. Gearless vessels are being sailed out after 48 hours without considering laden balance or empty loading scope. Extended port stays are restricted if laden units are not fed to the hook on time.
Sri Lanka
Colombo: The 7-day average vessel waiting time is around 1.08 days. The port remains congested despite recent capacity enhancements. Ongoing expansion projects and strategic partnerships are expected to alleviate pressure later in 2026. Poor weather conditions are causing additional disruptions.
Saudi Arabia
Jeddah: The 7-day average vessel waiting time is around 3 days.
Yemen
Aden: The 7-day average vessel waiting time is around 5 days.
North America
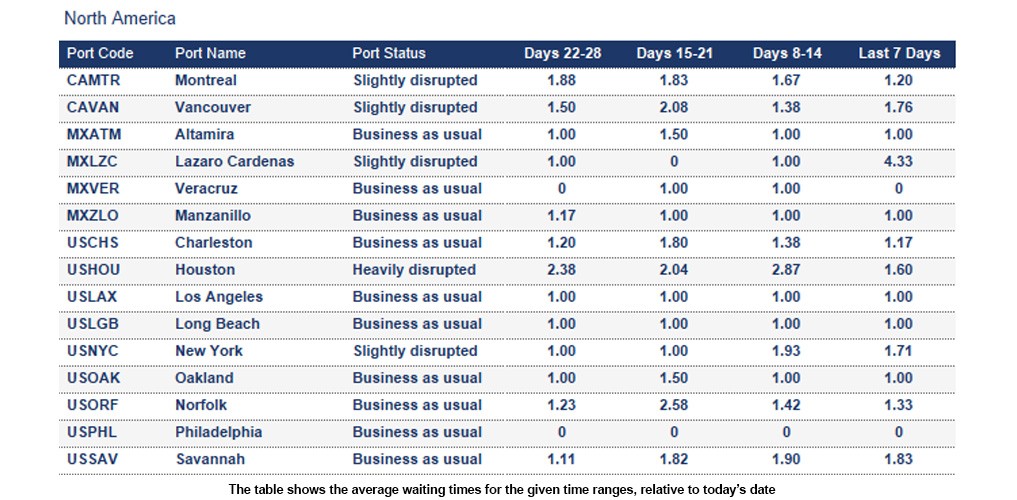
Canada
Average import rail dwell time for Canadian cargo (Vessel arrival to departure rail ramp):
- Halifax: 4 days
- Montreal: 5 days
- Prince Rupert: 7 days
- Saint John: 7 days
- Vancouver: 6 days
Saint John: The 7-day average vessel waiting time is around 4 days. The average rail dwell time is around 7 days. Persistent bad weather in the North Atlantic is causing vessel delays.
Vancouver: The 7-day average vessel waiting time is around 1.76 days. The average rail dwell time is around 6 days. The port is currently congested.
Mexico
Lazaro Cardenas: The 7-day average vessel waiting time is around 4.33 days.
United States
Houston: The 7-day average vessel waiting time is around 1.6 days. The port is currently affected by dense fog. Read more.
Mobile: The 7-day average vessel waiting time is around 1 day. Due to the dense fog in the US Gulf Coast region, cargo originally scheduled for Houston will be diverted to Mobile.
New York: Some carriers report waiting times of up to 3 days. The port is currently congested due to recent holidays as well as adverse weather.
South and Central America
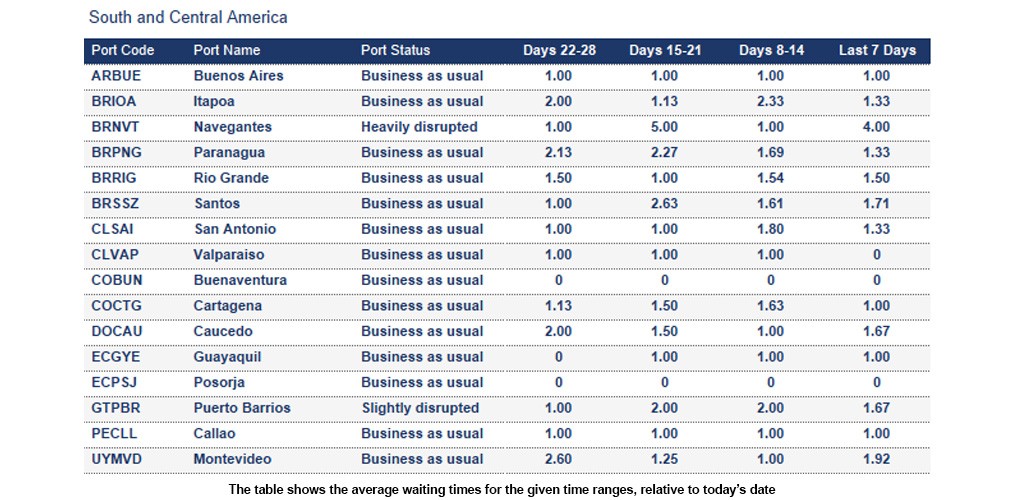
Chile
Iquique: Operations are currently affected by substantial congestion within the terminal yard, leading to reduced handling capacity and operational limitations. This disruption impacted terminal activity throughout December 2025 and has persisted despite the mitigation measures previously installed.
How Kuehne+Nagel estimates port disruption statuses
Seaexplorer has four port statuses that are estimated based mainly on the 7-day average vessel waiting time. Other factors include yard congestion, labour strikes, natural disasters or intermodal disruptions. Slightly different rules are applied to major ports, or ports that are hubs in their region, as they are typically more efficient.
- Business as usual means the port is currently operating without any significant disruption.
- Slightly disrupted is used if the 7-day average vessel waiting time exceeds 2 days.
- Heavily disrupted is used if the 7-day average vessel waiting time exceeds 4 days.
- Port closed is used when the port suspends operations due to a major disruptive event.
How Kuehne+Nagel calculates the 7-day average vessel waiting time
Mainline container vessels may spend a certain number of days waiting at designated anchorage areas before their scheduled port call.
To calculate the 7-day average waiting time, we consider the waiting days of these vessels, excluding:
- Waiting times for feeder vessels,
- Idle ships without an announced next port,
- Slow steamers heading toward the anchorage but not actively waiting within the designated area
- Vessels passing through the anchorage area without intending to call at the port.
This rolling average is based on the data from the last seven days and is updated daily in seaexplorer.
To find the latest waiting time for a port, enter the port name or code in the search bar and select the relevant option.
Stay Ahead Stay Informed: Register for seaexplorer for the latest disruptions and vessel waiting times at global container ports.