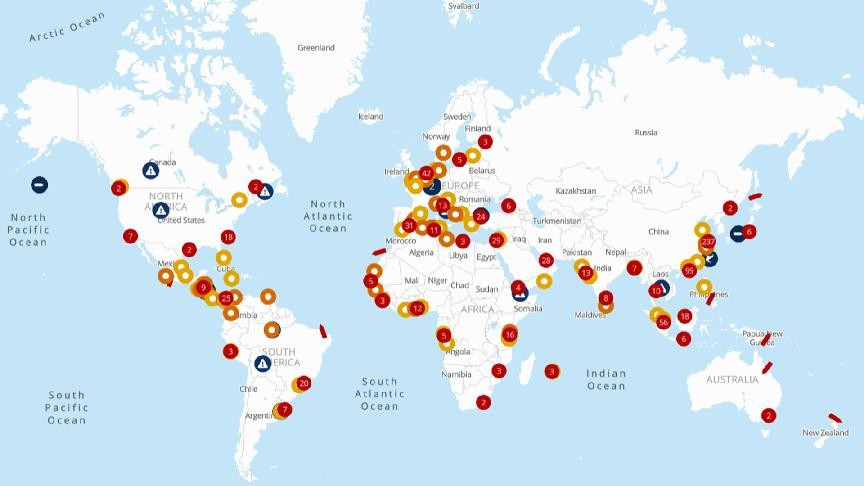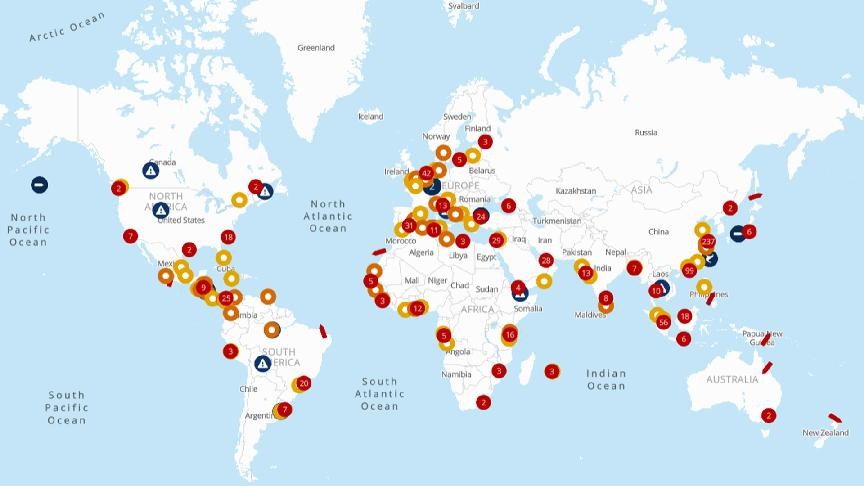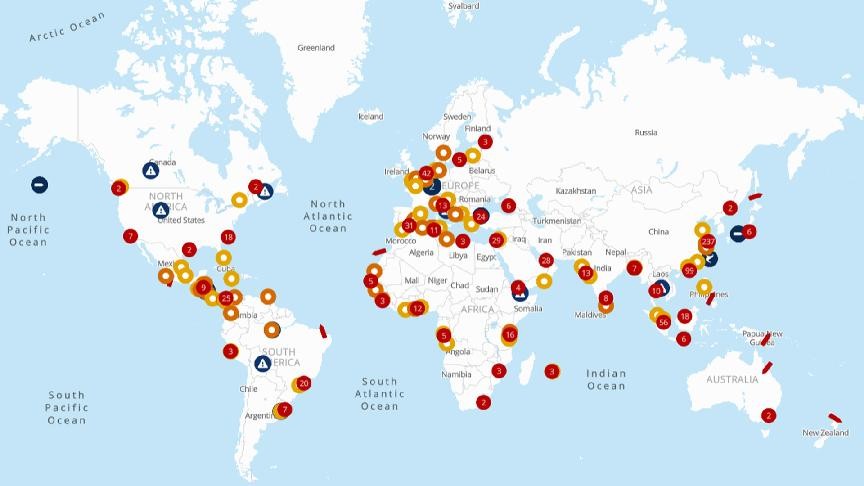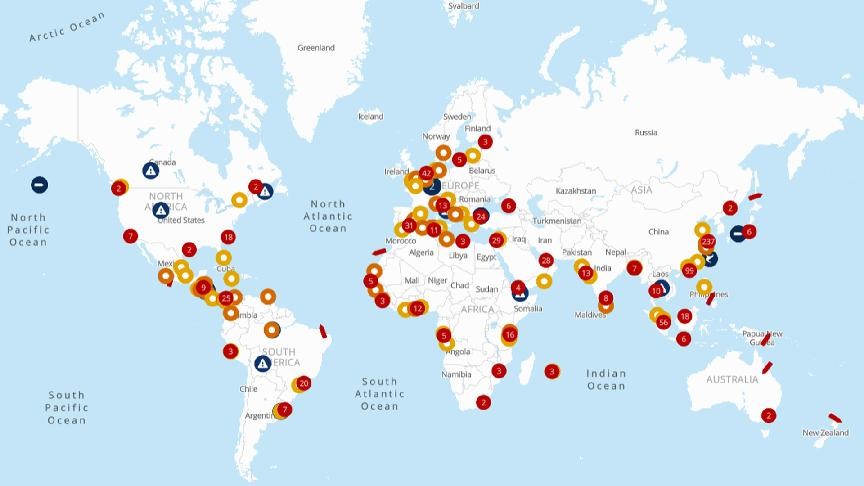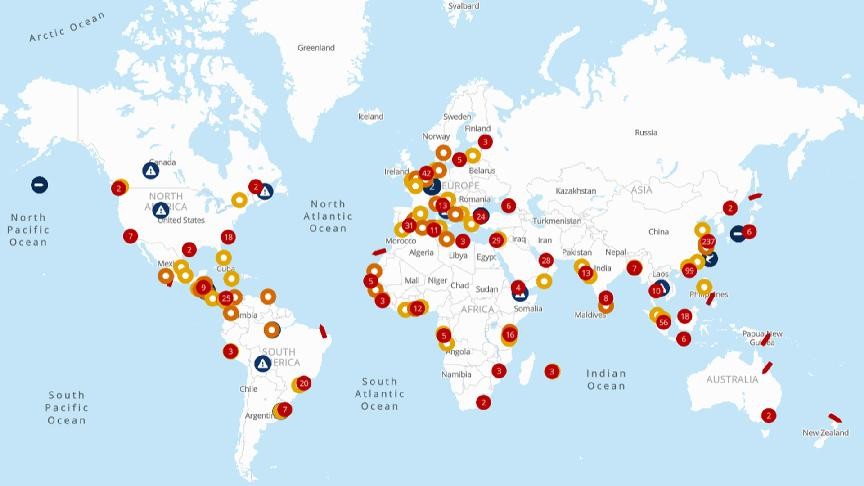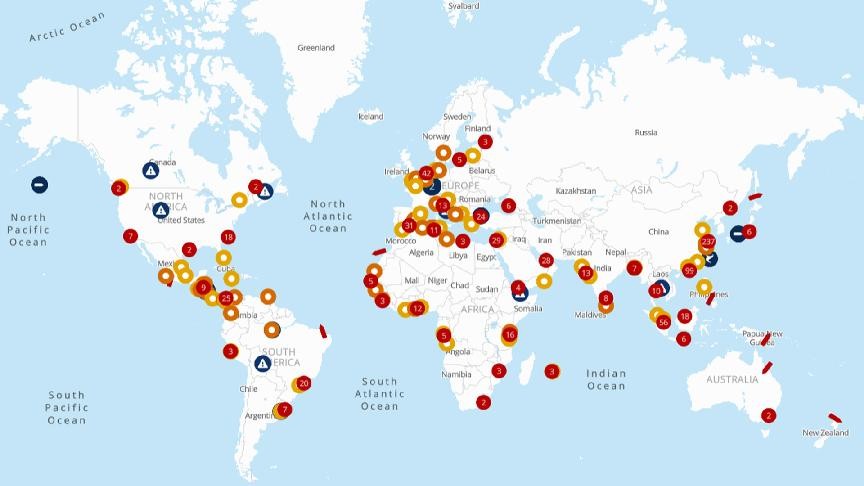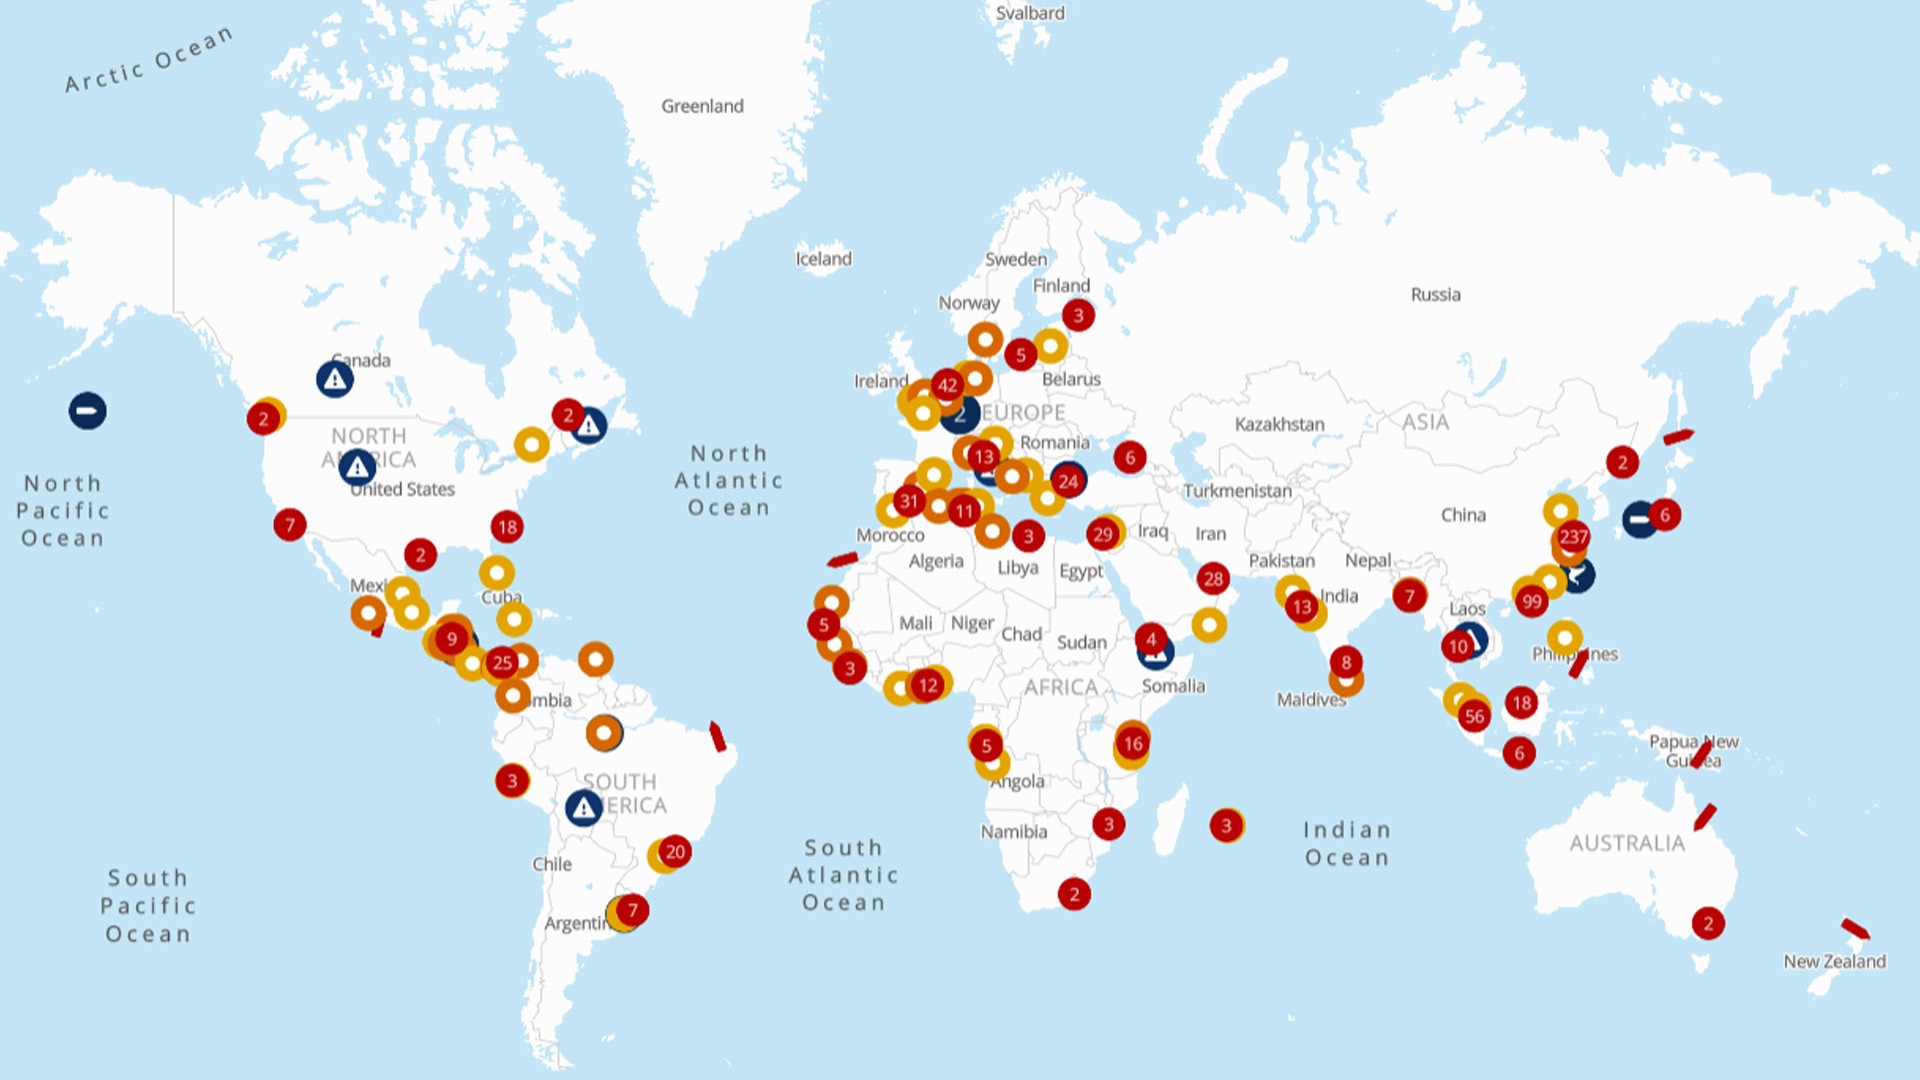

- Stay ahead of supply chain disruptions and port congestion with Kuehne+Nagel’s weekly port operational update.
- Find out the latest vessel waiting times and status of ports in Africa, Asia Oceania, Europe, Middle East-Indian Subcontinent, North America, and South and Central America.
Africa
Ghana
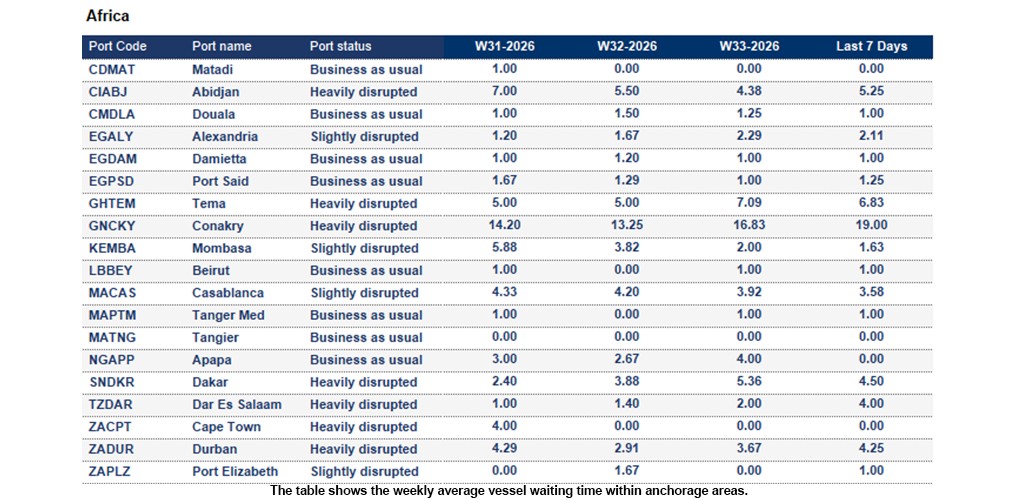
Tema: The 7-day average vessel waiting time is around 6.83 days. Terminal congestion remains severe. A crane outage, restricted berth availability and limitations on out-of-window vessel calls continue to impact operations and scheduling.
Guinea
Conakry: The 7-day average vessel waiting time is around 19.0 days. Port congestion remains high due to limited dry, reefer and empty container storage capacity. The 24/7 truck circulation initiative has improved cargo flows, but backlog recovery remains ongoing.
Ivory Coast
Abidjan: The 7-day average vessel waiting time is around 5.25 days. Significant congestion continues, with delays of around 8 days. High yard occupancy, berth waiting times and severe road congestion are affecting cargo flows, although recovery measures are currently being implemented.
Kenya
Mombasa: The 7-day average vessel waiting time is around 1.63 days. Congestion remains a long-term challenge. Equipment shortages, high transhipment volumes and vessel bunching continue to impact productivity and inland movements.
Mauritius
Port Louis: The 7-day average vessel waiting time is around 4.0 days. High transshipment volumes continue to create pressure on terminal and landside operations, although vessel delays remain limited.
Mozambique
Beira: The 7-day average vessel waiting time is around 16.11 days. Terminal recovery is expected later in the year, while adverse weather may further affect operations.
Nigeria
Tincan/Lagos: The 7-day average vessel waiting time is around 3.0 days. Delays continue amid ongoing inland logistics and congestion challenges.
South Africa
Cape Town: The 7-day average vessel waiting time is 0 days. Operations have stabilised, with delays generally between 0 and 3 days. Elevated citrus and reefer export volumes continue to place pressure on yard capacity and vessel planning, resulting in occasional rollovers of dry and hazardous cargo. Terminal performance remains sensitive to wind and swell conditions, although no major weather disruptions are forecast.
Durban: The 7-day average vessel waiting time is around 4.25 days. Durban remains under significant pressure, particularly at Pier 2 (DGT), where delays of 5-9 days persist due to congestion, NAVIS system implementation and increased waterside waiting times. Average anchorage delays range from 80 to 166 hours, with multiple vessels awaiting berths. Pier 1 remains more stable, although truck congestion and staging delays continue to impact operations.
Port Elizabeth: The 7-day average vessel waiting time is around 1 day. The Eastern Cape remains South Africa's most stable container gateway. Operations are largely normal, with delays limited to 0-2 days despite some weather-related productivity impacts. Reefer cargo continues to receive priority handling, although strong winds may occasionally reduce crane productivity and container handling rates.
Tanzania
Dar Es Salaam: The 7-day average vessel waiting time is around 4.0 days. Delays persist due to vessel waiting times, terminal congestion and road access constraints affecting cargo flows.
Asia Oceania
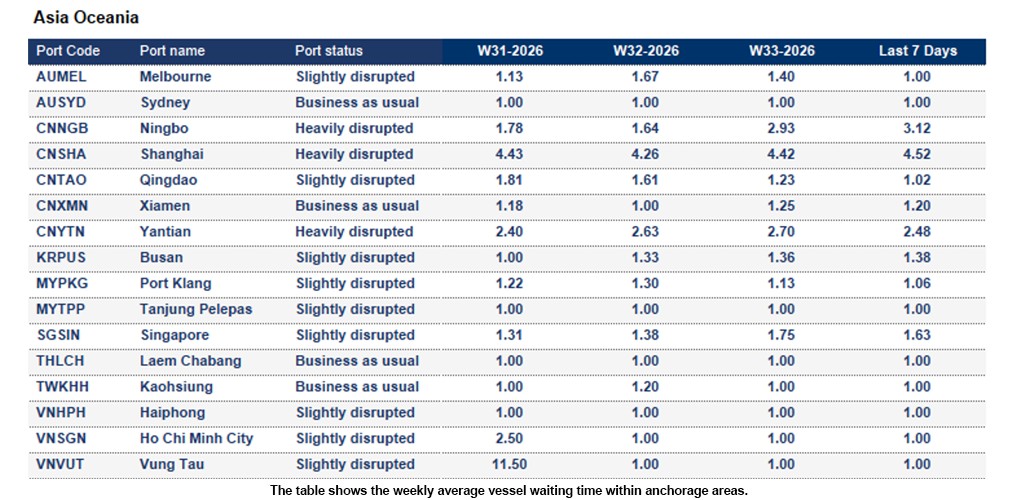
China:
Typhoon Dolphin continues to disrupt East China supply chains, with Shanghai and Ningbo facing vessel backlogs, elevated yard utilisation and ongoing schedule instability. Carriers are omitting selected port calls, increasing rollover risks and transit time variability. Additional pressure on equipment availability, vessel schedules and inland logistics is expected as terminals work through accumulated cargo volumes.
Hong Kong
Hong Kong: The 7-day average vessel waiting time is around 1.42 days. Port congestion continues due to delayed and bunched vessel arrivals.
Indonesia
Jakarta: The 7-day average vessel waiting time is around 1.59 days. Heavy berth congestion continues across all carriers.
Japan
Yokohama: The 7-day average vessel waiting time is around 1 day. Container yard and reefer plug utilisation remain high at 95%.
Malaysia
Port Klang: The 7-day average vessel waiting time is around 1.06 days. Operations remain stable with yard density around 80% and average delays of approximately 0.5 day. Dredging works have been completed, and all berths have returned to normal operation.
Philippines
Manila: The 7-day average vessel waiting time is around 2.52 days. Congestion remains moderate, driven by vessels recovering from previous China port disruptions.
Singapore
Singapore: The 7-day average vessel waiting time is around 1.63 days. Terminal waiting times are tight due to strong demand and vessel bunching, creating a more volatile operating environment.
South Korea
Busan: The 7-day average vessel waiting time is around 1.38 days. Heavy berth congestion continues, with laden yard utilisation exceeding 100% at BNCT and high transshipment inventory levels contributing to operational pressure.
Vietnam
Vung Tau: The 7-day average vessel waiting time is around 1 day. Congestion has improved, and yard density is returning to approximately 80%.
Europe
Belgium
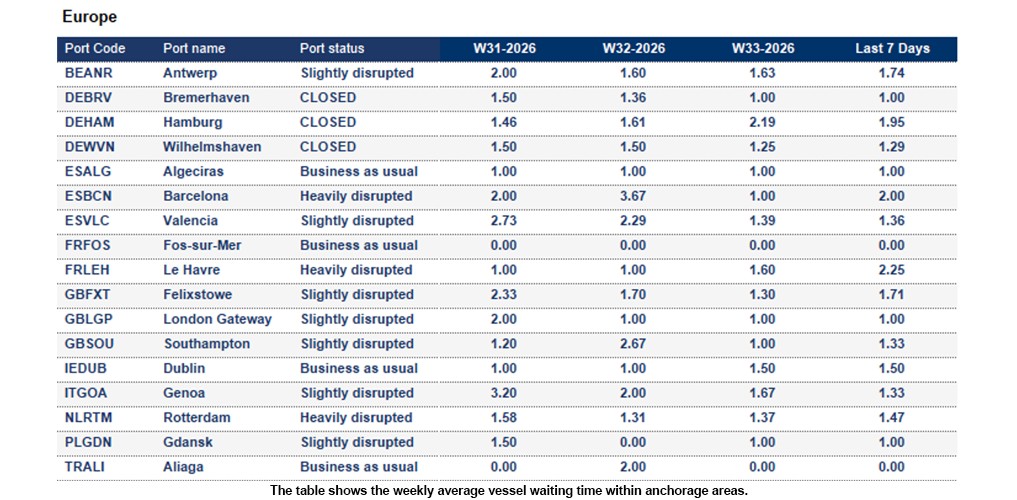
Antwerp: The 7-day average vessel waiting time is around 1.74 days. Operations remain stable, with yard occupancy at 55% (Q869) and 77% (Q913). However, pilot delays persist due to holiday-related staffing shortages and rest-hour requirements, which may impact vessel schedules and berth planning.
Germany
Read more here
Italy
Genoa: The 7-day average vessel waiting time is around 1.33 days. The PSA SECH Terminal in Genoa is experiencing significant operational congestion due to staffing shortages. The reduced workforce is impacting terminal capacity and the regularity of rail operations, increasing the risk of schedule changes, service rescheduling and potential departure cancellations. To mitigate disruption, the terminal has implemented temporary measures to limit rail traffic, which may continue to affect services to and from Genoa SECH over the next 2–3 weeks.
La Spezia: The 7-day average vessel waiting time is around 2.11 days. Delays persist due to berth constraints, trucking disruptions, labour shortages and vessel schedule amendments.
Netherlands
Rotterdam: The 7-day average vessel waiting time is around 1.47 days. Delays persist due to vessel queues, berth constraints, Rhine River disruptions and elevated yard occupancy.
Spain:
Barcelona: The 7-day average vessel waiting time is around 2.0 days. Seasonal volume increases continue to place pressure on yard capacity.
United Kingdom
London Gateway Port: The 7-day average vessel waiting time is around 1 day. Operations remain stable with yard occupancy at 72% dry and 39% reefer. A recent power outage caused a temporary disruption, while one quay crane remains out of service. Labour availability remains stable, though planned berth works in October may require temporary service adjustments.
Indian Subcontinent and the Middle East
Middle East:
Tensions in the Strait of Hormuz have increased after the US declined to extend its interim truce with Iran. Iranian officials have warned of possible military escalation if diplomatic efforts fail, raising concerns over shipping security in the region. At the same time, renewed Houthi activity in the Bab el-Mandeb Strait highlights growing risks across two critical maritime chokepoints. Read more here
Bangladesh
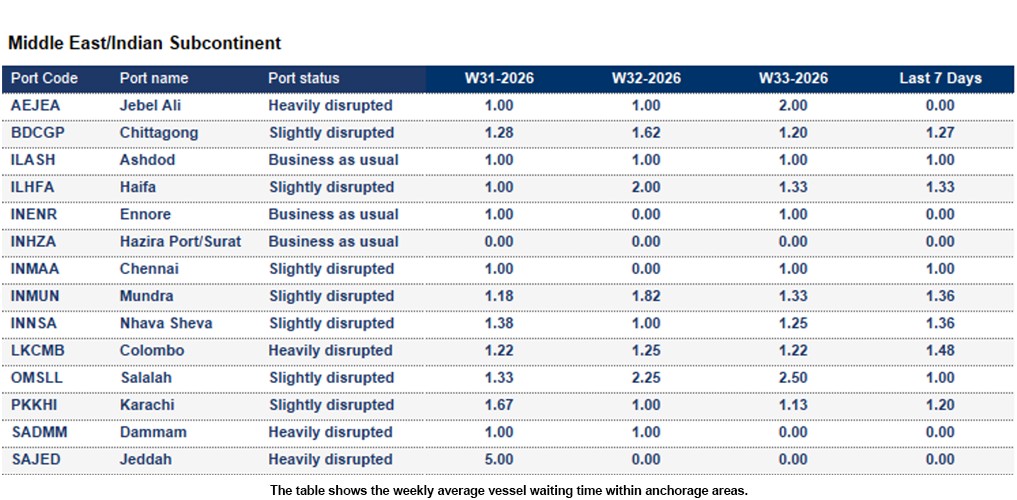
Chittagong (Chattogram): The 7-day average vessel waiting time is around 1.27 days. Yard utilisation remains around 80%, with berth waiting times of 1–2 days for both geared and gearless vessels. Operations remain stable overall.
India
Chennai: The 7-day average vessel waiting time is around 1 day. Operations continue to be affected by periodic monsoon disruptions, equipment imbalances and vessel schedule instability.
Mundra: The 7-day average vessel waiting time is around 1.36 days. Delays persist amid high terminal utilisation, periodic berth pressure and the ongoing effects of vessel bunching.
Nhava Sheva: The 7-day average vessel waiting time is around 1.36 days. Strong export demand, yard congestion and landside bottlenecks continue to place pressure on terminal capacity.
Pakistan
Karachi: The 7-day average vessel waiting time is around 1.2 days. Delays continue due to empty container congestion and monsoon-related disruptions affecting trucking operations and port access.
Sri Lanka
Colombo: The 7-day average vessel waiting time is around 1.48 days. Operations remain near capacity, with delays of up to 1 day. High transhipment demand, yard congestion and feeder schedule disruptions continue to affect performance. Waiting Time: 1.48 days.
North America
Canada
Average import rail dwell time for Canadian cargo (Vessel arrival to departure rail ramp):
- Halifax: 3 days
- Montreal: 7 days
- Prince Rupert: 6 days
- Saint John: 8 days
- Vancouver: 6 days
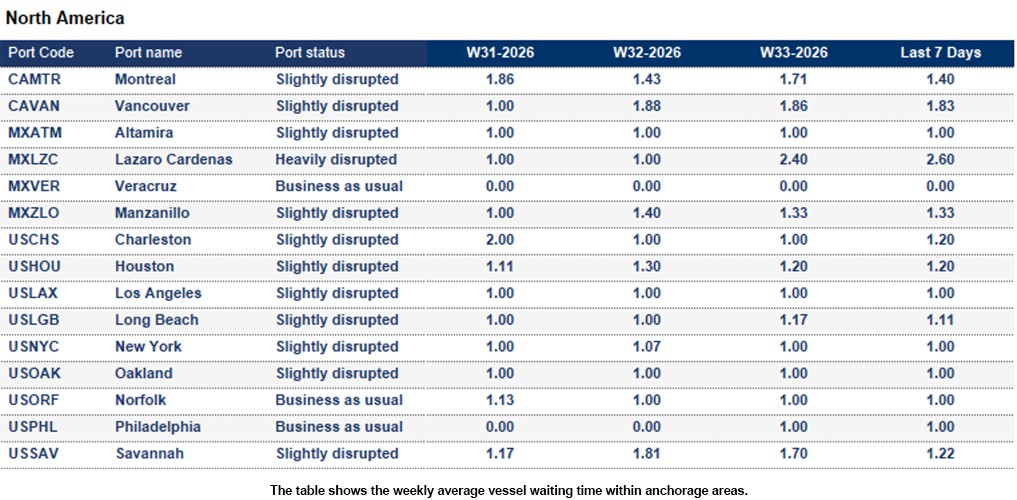
Vancouver: The 7-day average vessel waiting time is around 1.83 days. The average rail dwell time is around 8 days. Delays persist, while rail network bottlenecks continue to require close monitoring.
Mexico
Lazaro Cardenas: The 7-day average vessel waiting time is around 2.6 days. APM: The yard is at 83%, and the berth is congested.
Manzanillo: The 7-day average vessel waiting time is around 1.33 days. Delays continue amid sustained pressure on yard utilisation, although productivity has improved.
United States
Long Beach: The 7-day average vessel waiting time is around 1.11 days. Delays are reported, reflecting ongoing congestion and schedule instability across the US supply chain network.
Los Angeles: The 7-day average vessel waiting time is around 1 day. Delays continue as larger vessel calls, chassis shortages and drayage cost pressures impact terminal productivity.
New York: The 7-day average vessel waiting time is around 1 day. Congestion remains elevated. High terminal utilisation, vessel bunching, chassis shortages and extended dwell times continue to impact cargo flows.
Savannah: The 7-day average vessel waiting time is around 1.22 days. Operations are experiencing delays of around 3 days due to vessel bunching, trucking constraints and higher terminal dwell times.
South America and Central America
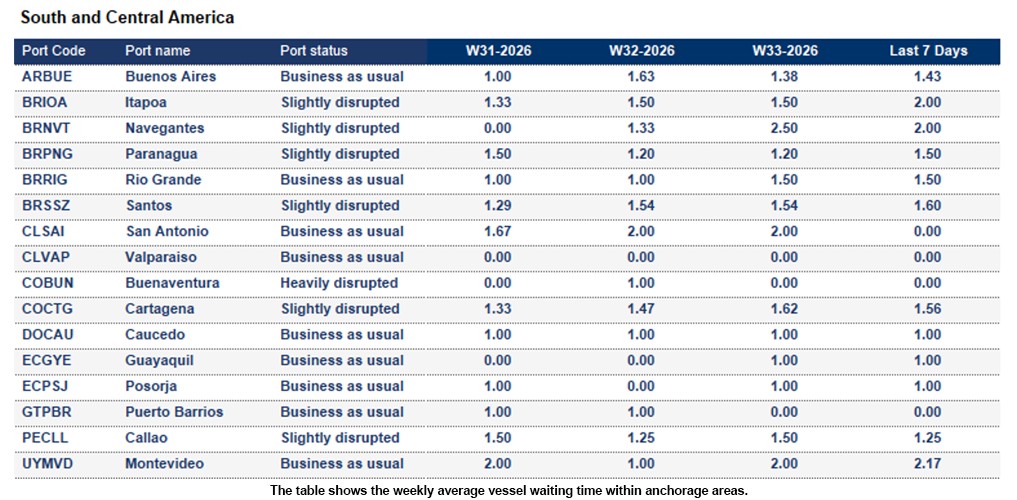
Brazil
Navegantes: The 7-day average vessel waiting time is around 2.0 days. Yard utilisation is at 78%. The Portnave terminal is carrying out civil works to receive larger vessels.
Paranagua: The 7-day average vessel waiting time is around 1.5 days. Congestion persists due to vessel bunching and strong agricultural export demand. Robust rail connectivity continues to support cargo flows.
Santos: The 7-day average vessel waiting time is around 1.6 days. Strong export volumes continue to pressure berth availability and vessel schedules.
Colombia
Buenaventura: The 7-day average vessel waiting time is 0 days. Container depots and port terminals remain operational with restrictions following the recent earthquake. Cargo backlogs, congestion and limited gate capacity continue to cause processing delays, while landslides and road restrictions are impacting truck transit times to and from the port. Several shipping lines have also confirmed vessel omissions, affecting schedule reliability.
How Kuehne+Nagel estimates port disruption statuses
Seaexplorer has four port statuses that are estimated based mainly on the 7-day average vessel waiting time. Other factors include yard congestion, labour strikes, natural disasters or intermodal disruptions. Slightly different rules are applied to major ports, or ports that are hubs in their region, as they are typically more efficient.
- Business as usual means the port is currently operating without any significant disruption.
- Slightly disrupted is used if the 7-day average vessel waiting time exceeds 2 days.
- Heavily disrupted if the 7-day average vessel waiting time exceeds 4 days.
- Port closure is used when the port suspends operations due to a major disruptive event.
How Kuehne+Nagel calculates the 7-day average vessel waiting time
Mainline container vessels may spend a certain number of days waiting at designated anchorage areas before their scheduled port call. To calculate the 7-day average waiting time, we consider the waiting days of these vessels, excluding:
- Waiting times for feeder vessels,
- Idle ships without an announced next port,
- Slow steamers heading toward the anchorage, but not actively waiting within the designated area
- Vessels passing through the anchorage area without intending to call at the port.
This rolling average is based on the last 7 days of data and is updated daily in seaexplorer. To find the latest waiting time for a port, enter the port name or code in the search bar and select the relevant option.
Stay Ahead, Stay Informed: Register for seaexplorer for the latest disruptions and vessel waiting times at global container ports.