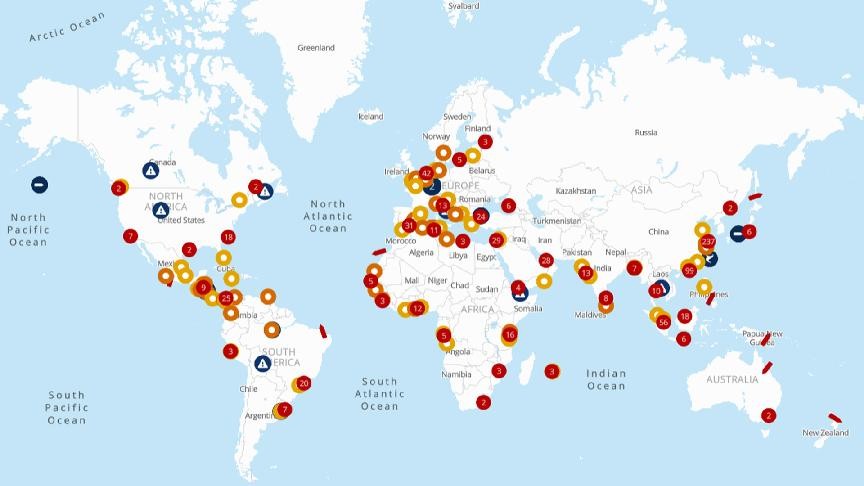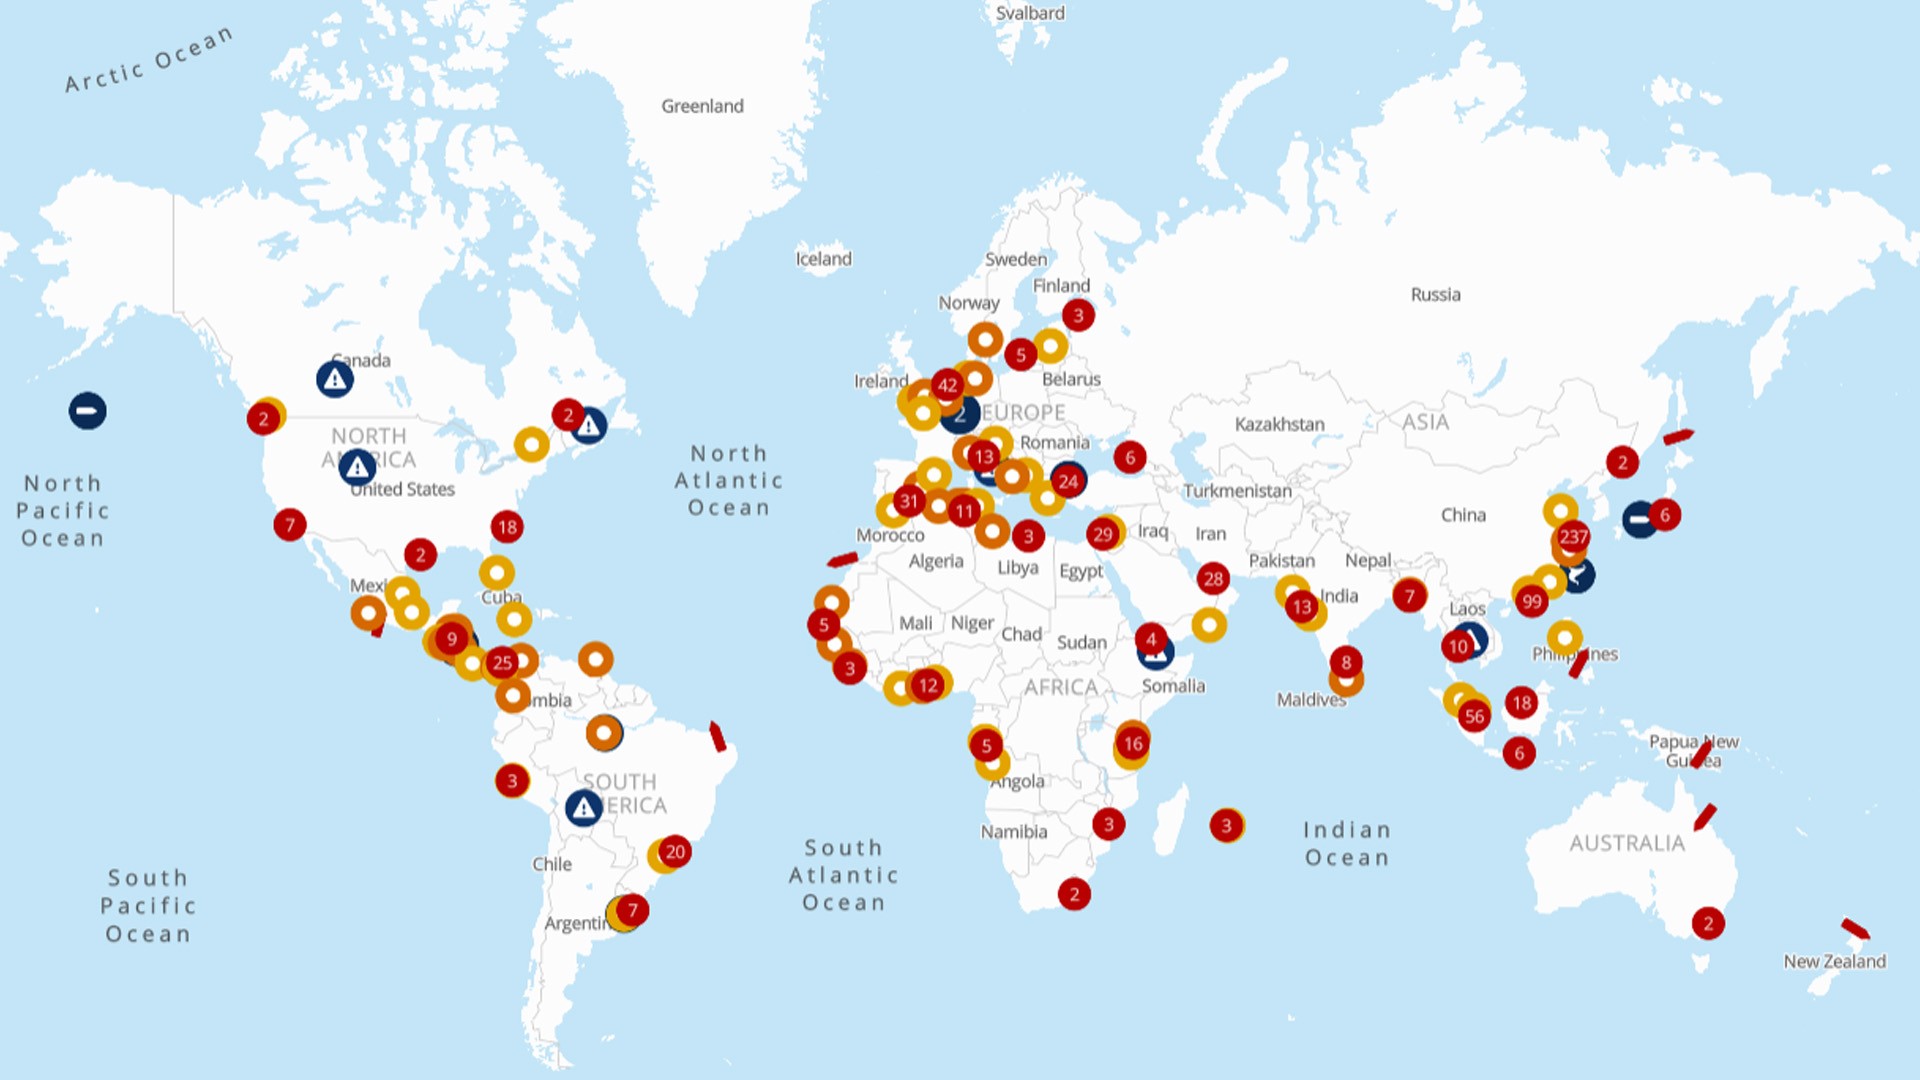

Stay ahead of supply chain disruptions and port congestion with Kuehne+Nagel’s weekly port operational update.
- Find out the latest vessel waiting times and status of ports in Africa, Asia Oceania, Europe, Middle East-Indian Subcontinent, North America, and South and Central America.
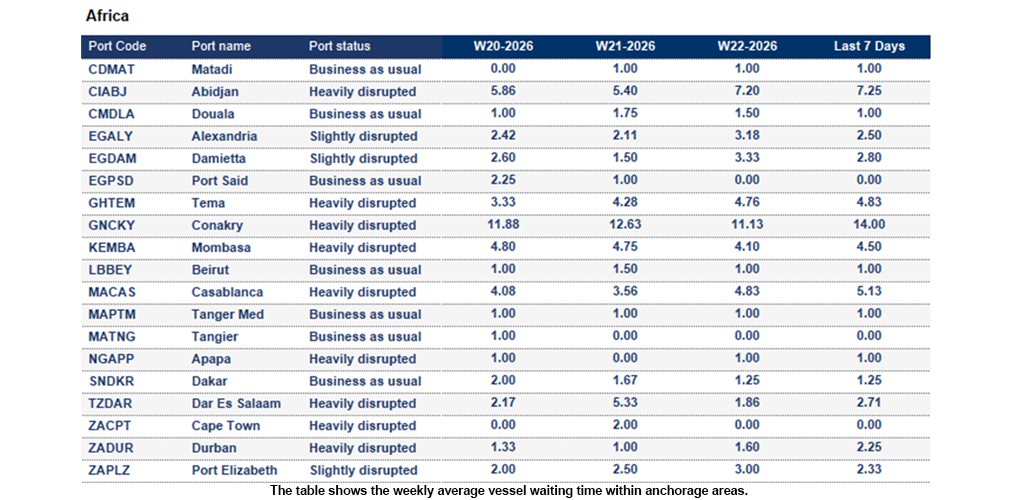
Africa
Ghana
Tema: The 7-day average vessel waiting time is around 4.83 days. Berth constraints, crane outages, and yard congestion are impacting vessel berthing schedules, resulting in delays to berthing times.
Guinea
Conakry: The 7-day average vessel waiting time is around 14.0 days. Severe congestion with long vessel waiting times, limited storage capacity and insufficient empty containers; mitigation measures include continuous truck circulation.
Ivory Coast
Abidjan: The 7-day average vessel waiting time is around 7.25 days. High yard utilisation and road congestion are impacting gate operations, with a high risk of scheduling delays and potential inland disruptions. Terminal throughput remains steady but under pressure, while recent power outages have contributed to berthing delays.
Kenya
Mombasa: The 7-day average vessel waiting time is around 4.5 days. A dual terminal structure remains in place, with KPA Terminal experiencing persistent congestion and extended vessel waiting times, while Kipevu Terminal shows improved performance and reduced delays. Nationwide strike action has led to road blockades and reduced trucking capacity, compounded by flood-damaged infrastructure along key Northern Corridor highways, further disrupting cargo flows.
Mauritius
Port Louis: Cloudy conditions with intermittent rain and strong wind gusts may lead to operational disruptions. Rising vessel calls linked to Cape of Good Hope re‑routing and Middle East impacts are increasing utilisation pressure. The multi-purpose terminal continues to perform reliably; however, limited expansion capacity heightens vulnerability to sudden volume surges and vessel bunching.
Mozambique
Beira: The 7-day average vessel waiting time is around 12.71 days. Terminal recovery is anticipated by weeks 32–33. Intermittent wind gusts and rain are expected to persist throughout the remainder of the week, with a potential impact on operations.
Nigeria
Apapa: The 7-day average vessel waiting time is around 1 day. Vessel clearance cycles can extend up to 30 days on certain services. Persistent road congestion and truck queuing are significantly impacting gate operations, resulting in continued delays.
Tincan/Lagos: Delays are being driven by a build-up of empty containers and intermittent gate closures, impacting terminal operations and overall flow.
South Africa
Cape Town: Carrier and service allocations may vary depending on berthing windows.
Port Elizabeth: The 7-day average vessel waiting time is around 2.33 days. NCT: Booking capacity remains tight, with transporters facing challenges in securing slots for container deliveries and pick-ups at the terminal.
Tanzania
Dar Es Salaam: The 7-day average vessel waiting time is around 2.71 days. Despite some recent terminal improvements, operations remain vulnerable due to ageing infrastructure and power reliability issues. In addition, multi-agency Customs processes continue to create clearance delays, impacting overall cargo flow and efficiency.
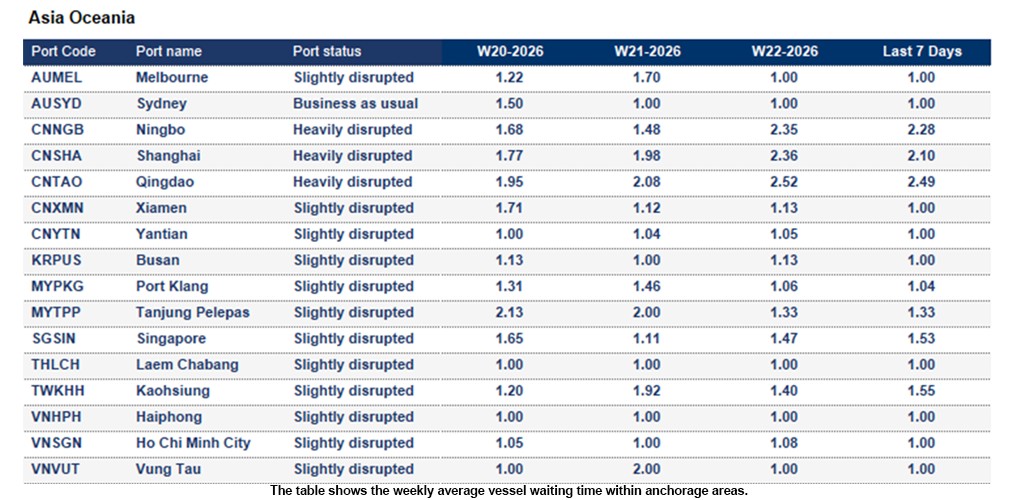
Asia Oceania
China
Qingdao: The 7-day average vessel waiting time is around 2.49 days. Severe fog led to port closures over the past 5 days, resulting in heavy congestion. Two cranes were removed at QQCT (28 May–2 Jun). One crane was installed at QQCTN (27–29 May), with the berth unavailable during this period.
Shanghai: The 7-day average vessel waiting time is around 2.1 days. Severe fog caused repeated port closures. Ongoing poor visibility is expected to prolong disruptions and increase waiting times further.
Indonesia
Semarang: The 7-day average vessel waiting time is around 3.0 days. The port is severely congested.
Malaysia
Tanjung Pelepas: The 7-day average vessel waiting time is around 1.33 days. Berthing situation remains dynamic with ongoing congestion. Commissioning of two new cranes completed; expected to support live operations from mid‑June. Approx. 120m of berth space at Berth 10 remains unavailable due to dredging works until 7 June.
Philippines
Manila: The 7-day average vessel waiting time is around 4.89 days. Heavy berth congestion persists at Manila North.
Singapore
Singapore: The 7-day average vessel waiting time is around 1.53 days. PSA terminals remain busy, with general waiting times exceeding one day across carriers.
South Korea
Busan: The 7-day average vessel waiting time is around 1 day. The overall situation may remain somewhat dynamic due to volatile vessel arrival times and the risk of vessel bunching in Busan.
Europe
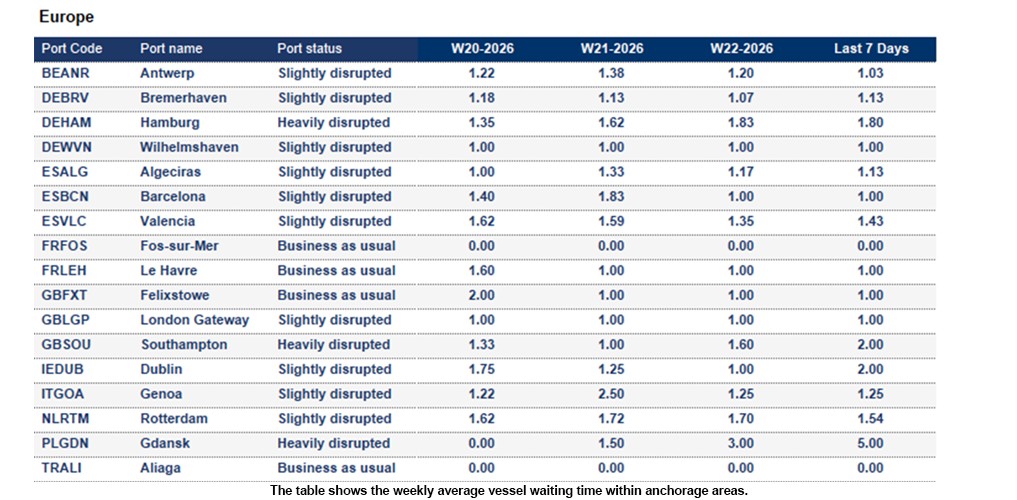
Belgium
Antwerp: The 7-day average vessel waiting time is around 1.03 days. BE/PSA (Q869/Q913): Q869 at 65% utilisation (Reefers 77%, MTs 50%); Q913 at 93% (Reefers 47%, MTs 80%). Crane maintenance this week: Q913 (Crane 5, Tue–Fri) and Q869 (Crane 23, Mon–Fri), impacting feeder and barge line-ups, with feeders handled between mainliners.
Germany
Severe disruption has been reported across Germany’s rail network due to ongoing construction, a fire, derailments, IT outages, and weather impacts. Major bottlenecks, train stacking, and halts in movement are affecting key corridors, leading to delays of up to 2–5 days for imports and exports and increasing scheduling unreliability across ports and inland connections. Read more.
Bremerhaven: The 7-day average vessel waiting time is around 1.13 days. Yard utilisation at 93% remains manageable; however, dangerous goods capacity is constrained. Post‑Pentecost line-up remains stable, though significant deviations in vessel arrivals pose a risk to operations.
Hamburg: The 7-day average vessel waiting time is around 1.8 days.
- CTA: Yard at 80% utilisation. Berth 1 cranes are partly operational with intermittent outages. Feeder operations between mainliners due to construction are delaying lineup, compounded by crane issues. Outlook remains challenging with feeders with unassigned berths.
- CTH: Yard utilisation at 95%, expected to ease before the weekend.
Wilhelmshaven: The 7-day average vessel waiting time is around 1 day. Yard utilisation is at 78% and stable. Post‑Pentecost line-up of mainliners and shuttles remains manageable; however, high sick leave is constraining operational capacity. Quay operations remain under pressure, with risks linked to upstream CTA/HAM delays.
Italy
Maintenance works on the Milan–Genoa rail corridor from 3 June to 30 September are expected to impact operations. Phased track closures between Pavia and Voghera will lead to service adjustments and temporary full suspension (20 July–28 August), affecting regional and long-distance rail connections. Read more.
Genoa: The 7-day average vessel waiting time is around 1.25 days. Carrier delays are being reported, with vessels arriving late on inbound services, resulting in knock-on impacts to outbound loadings.
La Spezia: The 7-day average vessel waiting time is around 1 day. Carrier delays are being reported, with vessels arriving late on inbound services, resulting in knock-on impacts to outbound loadings.
Netherlands
Rotterdam: The 7-day average vessel waiting time is around 1.54 days.
- NL/ECT: Yard stable at ~80%. Barge delays 0–24h; feeder delays 12–24h and increasing due to additional deep-sea call at Berth 3 impacting feeder windows.
- NL/MVII: Yard at ~85%. Elevated IMO volumes persist, with a delivery stop in place since 25 May, constraining capacity.
United Kingdom
London Gateway Port: The 7-day average vessel waiting time is around 1 day. Yard utilisation – Dry 53%, Reefer 68%. Reefer density is increasing; with Box Bay preparations underway, reefer capacity will be closely monitored and adjusted as required.
Southampton: The 7-day average vessel waiting time is around 2.0 days. Berth SCT5: The arrival of the new crane has been advanced to 13 June. The berth will be unavailable from 13 to 22 June due to crane installation and positioning activities. Yard utilisation stands at 88% for dry cargo and 63% for reefer units.
Middle East - Indian Subcontinent
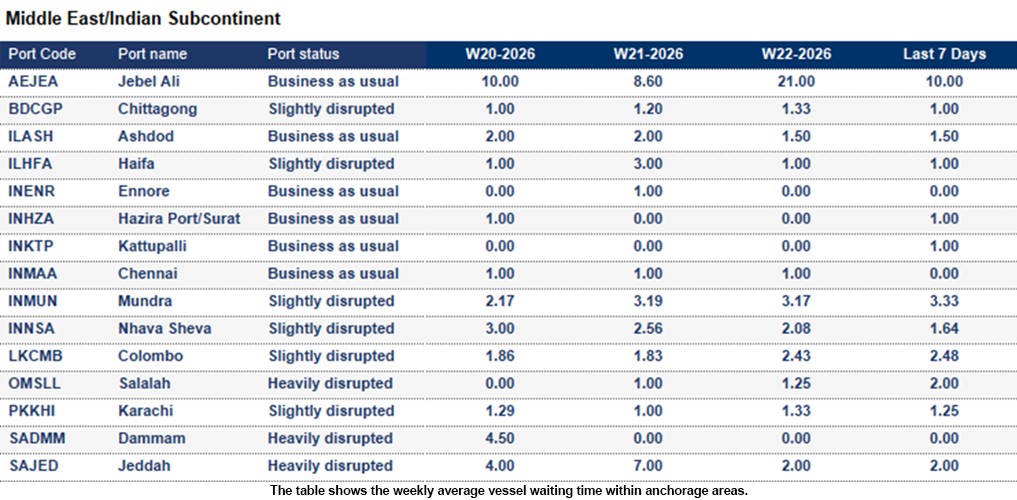
Middle East: Escalating risks around the Strait of Hormuz have been highlighted, with US advisories warning of potential security threats and sanctions constraints impacting transit. Shipping lines face operational uncertainty due to sanction risks and possible Iranian intervention. While bunkering supply remains stable, heightened geopolitical tensions may disrupt routing decisions and maritime operations. Read more
India
Mundra: The 7-day average vessel waiting time is around 3.33 days. Carrier schedules remain erratic, with ongoing delays being reported. Extended import dwell times persist due to export prioritisation and efforts to clear the existing backlog.
Nhava Sheva: The 7-day average vessel waiting time is around 1.64 days. The port is handling increased volumes driven by Middle East disruptions, vessel re‑routings, and schedule changes. Gate congestion is impacting truck turnaround times, while elevated yard utilisation, empty imbalances, and export prioritisation are extending import dwell times. Hinterland bottlenecks persist, with rail delays to inland ICDs and heavy road congestion across Mumbai and Gujarat corridors.
Pakistan
Karachi: The 7-day average vessel waiting time is around 1.25 days. A significant volume surge has been reported due to the Middle East crisis, with the port emerging as an alternative hub. Terminal capacity remains limited under rapid growth conditions, resulting in a high risk of further congestion. A substantial volume surge of approximately 1400% has been reported due to the Middle East crisis, with the port emerging as an alternative hub. Terminals are operating at maximum capacity. Poor road infrastructure is causing delays and congestion, while limited rail connectivity and reliance on road transport are further exacerbating bottlenecks.
Sri Lanka
Colombo: The 7-day average vessel waiting time is around 2.48 days. Increased transhipment volumes and vessel activity are being experienced, resulting in significant terminal and yard congestion, as well as inter-terminal transfer delays. There is an elevated risk of port omissions due to congestion spikes, with primary bottlenecks observed within port yards and Customs processes.
North America
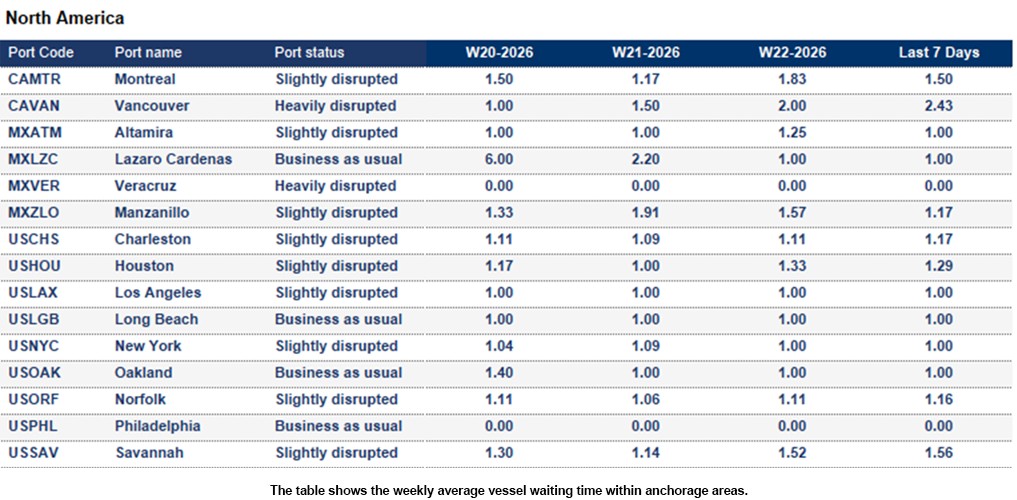
Canada
Average import rail dwell time for Canadian cargo (Vessel arrival to departure rail ramp):
- Halifax: 5 days
- Montreal: 5 days
- Prince Rupert: 9 days
- Saint John: 4 days
- Vancouver: 6 days
A strike by signal and communications workers on 31 May has increased pressure on the CPKC rail network across Canada. While contingency measures are in place to maintain operations, disruptions may still impact rail flows. Operations in the United States remain unaffected. Read more.
Montreal: The 7-day average vessel waiting time is around 1.5 days. The average rail dwell time is around 5 days. Yard utilisation remains high but stable, while rail car availability has improved, supporting more consistent inland operations.
Vancouver: The 7-day average vessel waiting time is around 2.43 days. The average rail dwell time is around 6 days. Moderate congestion is being observed; however, rail dwell times and intermodal delays are impacting overall performance and contributing to operational delays.
Mexico
Veracruz: The 7-day average vessel waiting time is around 0 days. Increased delays are being experienced due to adverse weather conditions, with vessels arriving outside their scheduled berthing windows.
United States
Average import rail dwell and transit time for US cargo (Vessel arrival to departure rail ramp):
- Halifax - 11 days
- Montreal - 9 days
- Prince Rupert - 8 days
- Vancouver - 6 days
- Saint-John - 7 days
- Charleston - 3 days
- Newark - 2 days
- Houston - 8 days
- Jacksonville - 3 days
- Los Angeles - 5 days
- Long Beach - 8 days
- New York - 5 days
- Miami - 1 day
- Oakland - 5 days
- Norfolk - 3 days
- Philadelphia - 10 days
- Savannah - 2 days
- Seattle - 4 days
- Tacoma - 4 days
Los Angeles: The 7-day average vessel waiting time is around 1 day. Drayage delays and extended gate turn times are impacting trucking productivity and overall landside efficiency.
Miami: The 7-day average vessel waiting time is around 2.0 days.
New York: The 7-day average vessel waiting time is around 1 day. Carrier schedules remain erratic, with ongoing vessel bunching. Slipped and cascading schedules are being observed across the USA–ZA–USA trade.
Savannah: The 7-day average vessel waiting time is around 1.56 days. Terminal expansion works are limiting short-term berth capacity. Rail congestion and drayage constraints are also being experienced, further impacting overall operations.
South and Central America
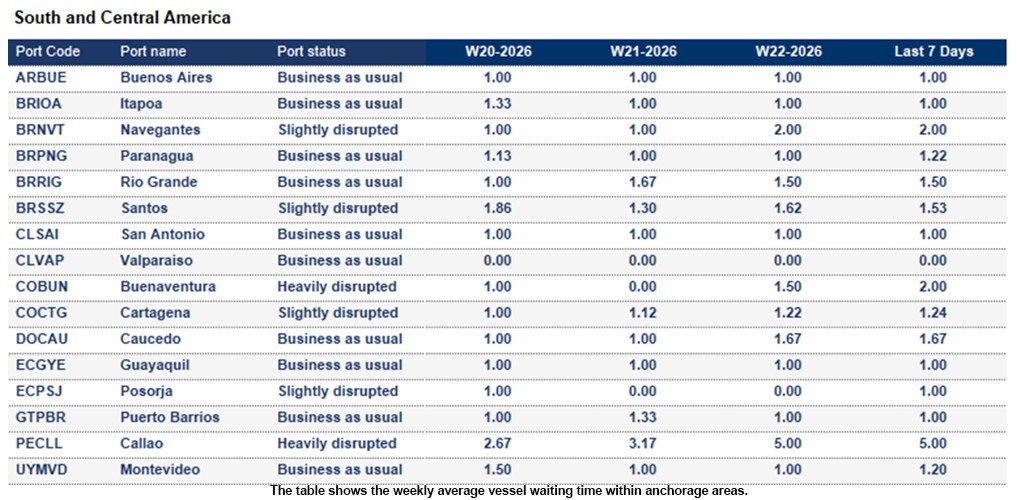
Brazil
Santos: The 7-day average vessel waiting time is around 1.53 days. High container volumes persist, with Customs inspections slowing container release and causing significant delays to cargo movements. Gate appointment pressure and trucking congestion are further impacting overall operational efficiency.
Colombia
Buenaventura: The 7-day average vessel waiting time is around 2.0 days.
How Kuehne+Nagel estimates port disruption statuses
Seaexplorer has four port statuses that are estimated based mainly on the 7-day average vessel waiting time. Other factors include yard congestion, labour strikes, natural disasters or intermodal disruptions. Slightly different rules are applied to major ports, or ports that are hubs in their region, as they are typically more efficient.
- Business as usual means the port is currently operating without any significant disruption.
- Slightly disrupted is used if the 7-day average vessel waiting time exceeds 2 days.
- Heavily disrupted is used if the 7-day average vessel waiting time exceeds 4 days.
- Port closed is used when the port suspends operations due to a major disruptive event.
How Kuehne+Nagel calculates the 7-day average vessel waiting time
Mainline container vessels may spend a certain number of days waiting at designated anchorage areas before their scheduled port call.
To calculate the 7-day average waiting time, we consider the waiting days of these vessels, excluding:
- Waiting times for feeder vessels,
- Idle ships without an announced next port,
- Slow steamers heading toward the anchorage, but not actively waiting within the designated area
- Vessels passing through the anchorage area without intending to call at the port.
This rolling average is based on the last 7 days of data and is updated daily in seaexplorer. To find the latest waiting time for a port, enter the port name or code in the search bar and select the relevant option.
Stay Ahead, Stay Informed: Register for seaexplorer for the latest disruptions and vessel waiting times at global container ports.