

- As a leader in sea logistics, Kuehne+Nagel closely tracks and collects data on the movement of vessels, including actual arrivals and vessel delays.
- A summary of this analysis, based on neutral data, is published monthly in our Schedule Reliability Report, available on Sea News.
Executive Summary
Global schedule reliability fell to 51.9% in July, down 4.7 percentage points from June and the lowest level recorded so far in 2026. While performance remained above July 2024 levels, it was below July 2025 and continued the downward trend that followed May's peak.
Arrival delays also increased, pointing to a broader weakening in vessel arrival performance across the network. Average delays rose from 3.8 to 4.2 days for LATE vessels and from 1.7 to 2.0 days across ALL vessels.
Schedule reliability weakened across the network, with most trade lanes recording lower results and only two corridors improving month-on-month. North America East Coast ↔ South America West Coast remained the strongest-performing trade lane overall at 82.3%, while Asia ↔ North America West Coast continued to lead the major Asia trades. In contrast, Asia ↔ North Europe and Asia ↔ Mediterranean/Black Sea recorded the lowest on-time performance levels among the key Asia corridors.
On the featured Asia ↔ North America West Coast trade, the headhaul corridor remained comparatively resilient, supported by stable ALL-vessel delays and a slight improvement in LATE-vessel delay performance. In contrast, the backhaul corridor experienced weaker on-time performance and longer delays, leading to an overall deterioration in the trade during the month.
Global On-TimePerformance
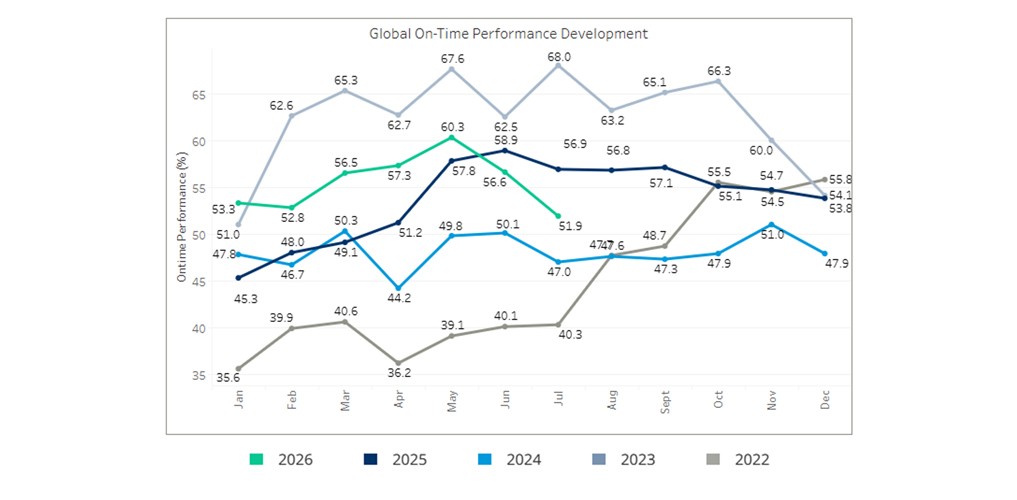
Global schedule reliability decreased from 56.6% in June to 51.9% in July, representing a month-on-month decline of 4.7 percentage points. Compared to July 2025, reliability was 5.0 percentage points lower, while remaining 4.9 percentage points above July 2024.
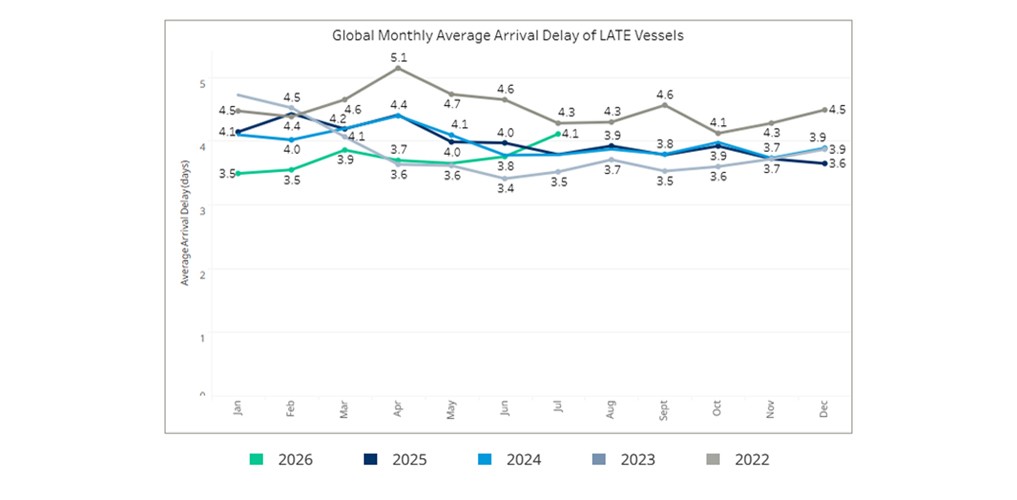
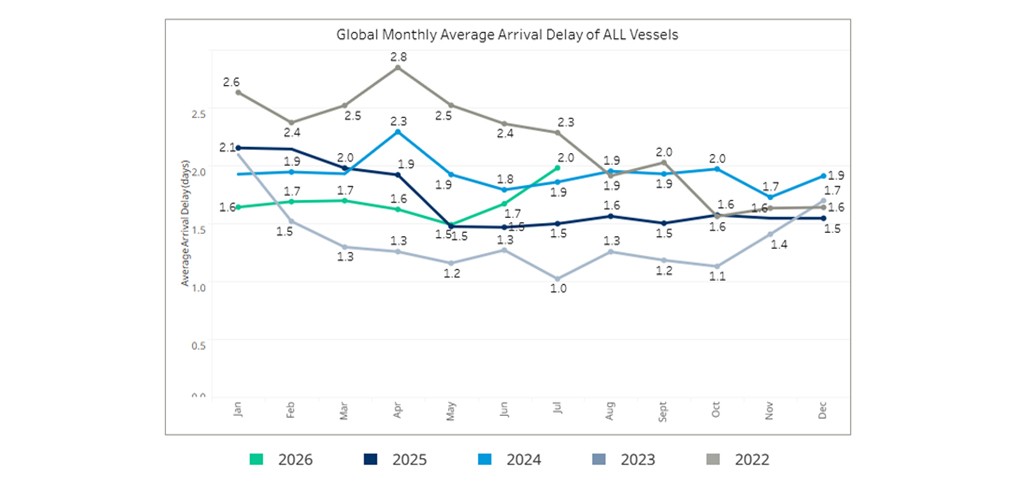
The overall decline was accompanied by higher arrival delays. Average delay increased from 3.8 to 4.2 days for LATE vessels and from 1.7 to 2.0 days across ALL vessels.
The increase in both delay measures indicates a broad weakening in arrival performance during July, reversing part of the improvement seen during the first half of 2026.
Reliability per Trade Lane
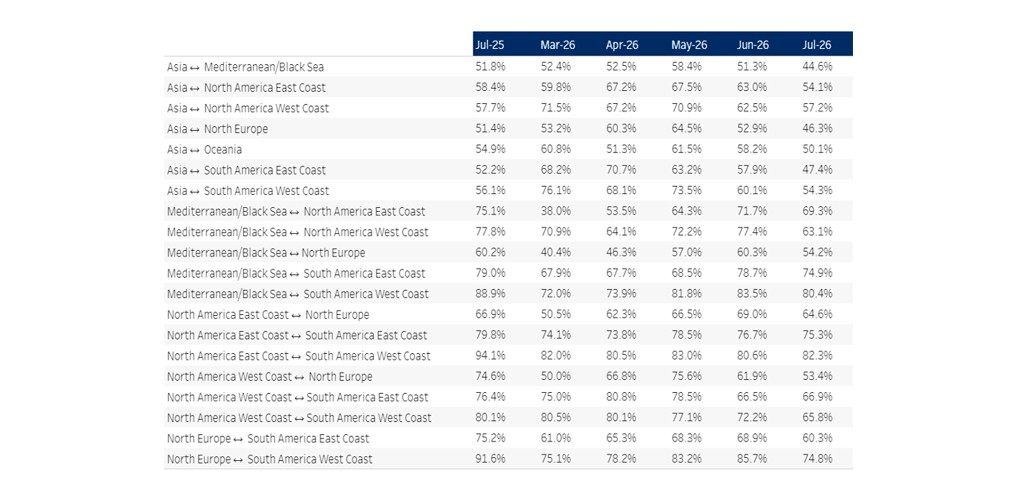
Trade lane reliability softened across most corridors in July, with 16 of 18 trade lanes recording lower performance than in June.
North America East Coast ↔ South America West Coast remained the strongest-performing trade lane overall, while Asia ↔ North America West Coast continued to lead the Asia trades. In contrast, Asia ↔ North Europe and Asia ↔ Mediterranean/Black Sea recorded the lowest reliability levels among the major Asia corridors.
Reliability on Asia ↔ North America West Coast
Asia ↔ North America West Coast was the most reliable Asia trade lane in July, achieving an on-time performance of 57.2%. While reliability declined by 5.3 percentage points compared to June, it remained above July 2025 levels.
Arrival performance also weakened during the month. The average delay across ALL vessels increased from 1.6 to 1.8 days, while the average delay for LATE vessels rose from 3.8 to 4.2 days. July 2026 recorded the highest July LATE-vessel delay on this trade since 2022.
A closer look at the headhaul and backhaul corridors highlights the different drivers behind the trade's July performance.
Headhaul
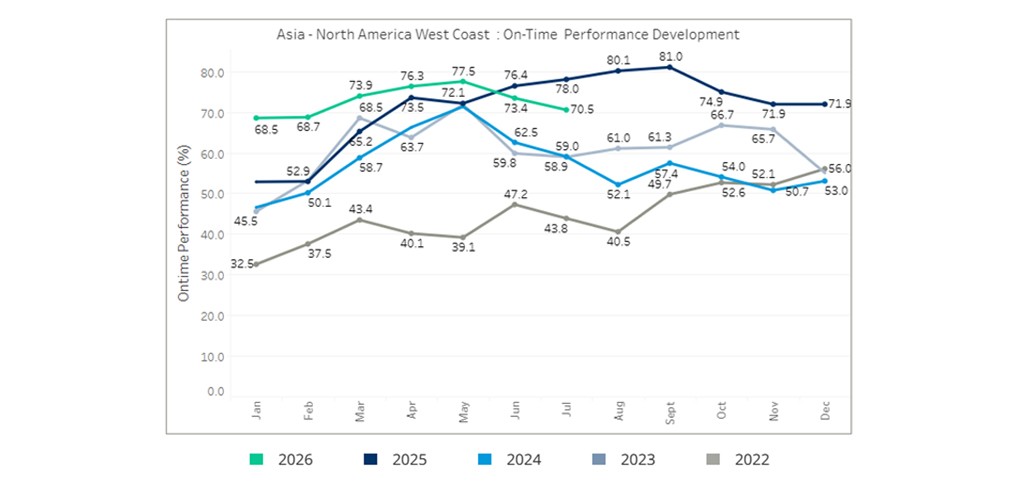
Asia → North America West Coast recorded an on-time performance of 70.5% in July, down 2.9 percentage points from June. Despite the decline, reliability continued to outperform July results from 2022–2024, while remaining below the exceptional July 2025 level of 78.0%.
Delay performance improved during the month, with the average delay for LATE vessels decreasing from 3.2 to 3.0 days, while the average delay across ALL vessels remained stable at 0.9 days. Despite lower reliability, the severity of delays improved slightly compared to June.
Backhaul
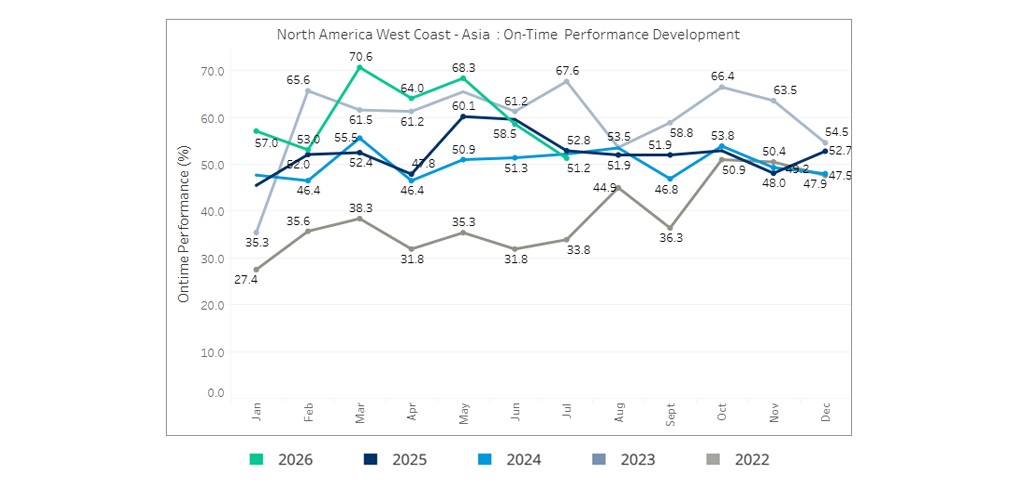
North America West Coast → Asia recorded an on-time performance of 52.8% in July, down 8.4 percentage points compared to June. Reliability remained broadly in line with July 2025 (52.8%) and July 2024 (51.2%).
Arrival delays also deteriorated during the month. The average delay across ALL vessels increased from 1.7 to 2.2 days, while the average delay for LATE vessels rose from 3.9 to 4.5 days.
The backhaul corridor was the primary driver of the trade's July deterioration, as lower on-time performance and increasing delays weighed on overall trade performance.
Methodology
Calculating the on-time performance
To calculate the on-time performance of a service,Kuehne+Nagel uses vessel schedules from carrier(s) offering that service. Onlycarrier schedules that match our quality criteria are used for the schedulereliability calculation.
As carriers update schedules constantly, they become moreaccurate the closer vessels get to a destination port. For this reason, we haveimplemented a "schedule freeze period" of 14 days prior to actualvessel arrival. In other words, we benchmark the actual arrival with whatcarriers last announced 14 days earlier. To identify the actual time ofarrival, Kuehne+Nagel consumes AIS (Automatic Identification System) vesseldata.
All vessels which arrive within a +/- 24-hour window at the port ofdestination compared to the last announced arrival are considered to be ontime. Port call omissions and blank sailings announced after the 14-day freezeare excluded from the calculation.
Assigning carrier services to multiple trade lanes
Many services operate on various trade lanes (e.g. a carrierservice between Asia and North Europe also calls ports in the Middle East andor the Mediterranean), and therefore carrier services may be listed in multipletrade lanes.
Definition of trade lanes
There is no common standard for the definition of tradelanes. This means, depending on the source, you will find different trade lanesas well as different regions, countries and ports assigned to a trade lane.Kuehne+Nagel has defined its own way of mapping and has assigned ports to thesetrade lanes accordingly. On-time performances of vessels are captured in ourreports on defined main trades, meaning trades moving large container volumeson vessels. Therefore, niche trades and services within one trade, called"Intra Trade" services (e.g. Intra-Asia, Intra-Europe), are currentlyout of scope.
A PDF version of this report can be found here.