- As a leader in sea logistics, Kuehne+Nagel closely tracks and collects data on the movement of vessels, including actual arrivals and vessel delays.
- A summary of this analysis, based on neutral data, is published monthly in our Schedule Reliability Report, available on Sea News.
Executive Summary
October 2025 marked a period of both progress and renewed volatility in global container shipping reliability.
Global schedule reliability reached 53.3%, reflecting a notable year-over-year improvement but a slight decline from the previous month. The average arrival delay for LATE vessels remained high at 3.9 days, while the average delay for all vessels remained steady at 1.6 days.
Trade lane analysis revealed that some trade lanes performed well, while others faced setbacks. The Mediterranean/Black Sea↔South America and North America↔South America routes led with reliability rates above 75% and 80%, respectively, while the Asia↔North Europe and North Europe↔South America routes experienced significant month-over-month declines.
Nine of the eleven main trades posted year-over-year gains, showing broad-based improvements; however, several lanes saw a decline in reliability compared to September.
This month’s report focuses on the Transatlantic trade, which presented a nuanced picture. Westbound reliability peaked above 70% in May but declined to below 65% by October, with average arrival delays rising in tandem. Eastbound, reliability started at 28.7%, peaked at 73.5% in August, and dropped to 46.7% by October. Despite these declines, both directions outperformed 2024, underscoring progress in managing operational complexity.
Looking ahead, the data highlights the need for continued vigilance and adaptability. While year-over-year gains are encouraging, recent month-over-month declines and persistent arrival delays signal that volatility remains a defining feature of global shipping.
Global On-Time Performance
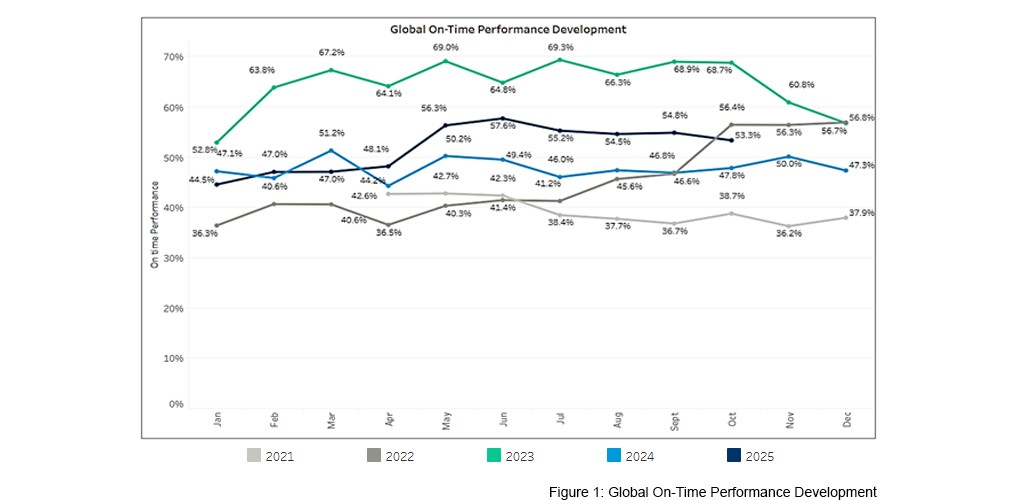
Global schedule reliability reached 53.3% in October 2025, a slight decline from September’s 54.8%.
Despite this month-over-month dip, reliability remains significantly higher than in October 2024, when the figure stood at 47.8%.
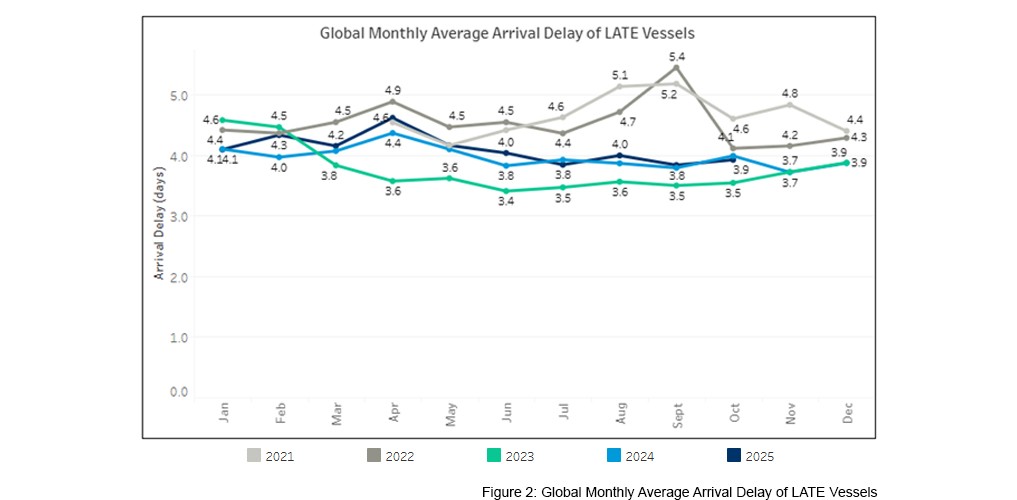
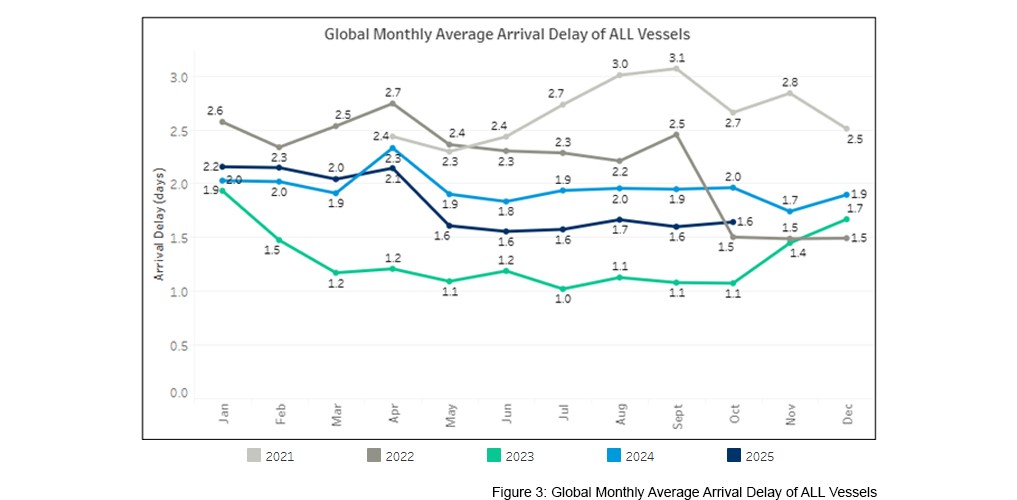
The average delay for LATE vessels remained high at 3.9 days, and the overall average delay was steady at 1.6 days.
These results highlight both the progress made over the past year and the ongoing volatility in the global liner industry.
Reliability per Trade Lane
Schedule reliability across major trade lanes displayed a mix of positive and negative trends, both compared to the previous month and to October 2024.
Asia↔South America saw the largest monthly gain, rising by 3.4 percentage points to 54.0%. In contrast, North America↔North Europe experienced the largest monthly drop, down 14.5 points to 53.5%.
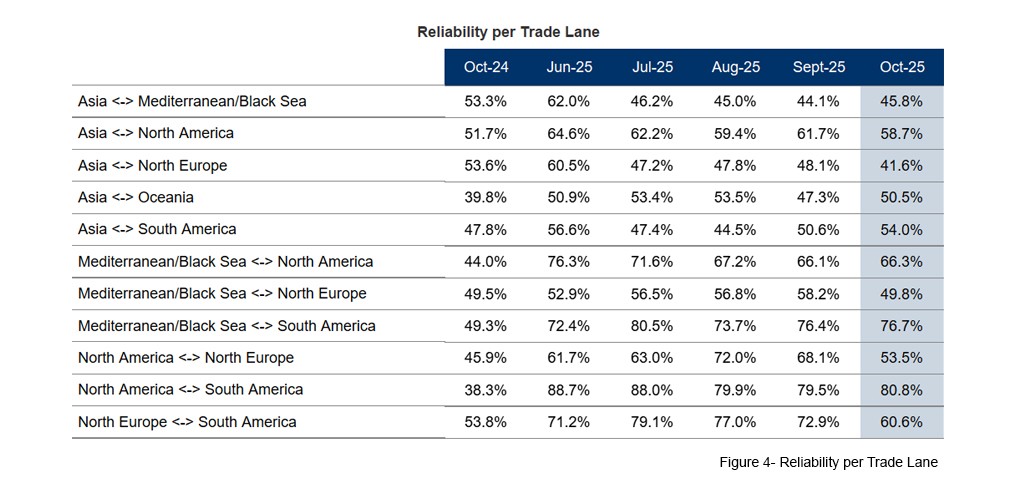
Several trade lanes achieved strong year-over-year improvements, with the North America↔South America route showing the most substantial annual gain, up 42.6 points from October 2024.
In addition, Mediterranean/Black Sea↔South America improved by 27.4 points, and Mediterranean/Black Sea↔North America rose by 22.3 points.
Reliability on Transatlantic
This month’s report highlights the Transatlantic trade route, which showed the largest month-over-month decline in October. On-time reliability for this route decreased to 53.5%, from 68.1% in September. This represents a 14.5 percentage point loss.
LATE vessels on this route arrived an average of 4.2 days after their scheduled time. For ALL vessels, the average arrival delay was 1.7 days.
Operational challenges, including strikes, rail disruptions, as well as winter weather, are impacting carrier schedules on this route. The following sections provide a detailed breakdown of performance for each direction.
Westbound
In 2025, westbound Transatlantic schedule reliability started strong, peaking above 70% in May before declining to below 65% by October.
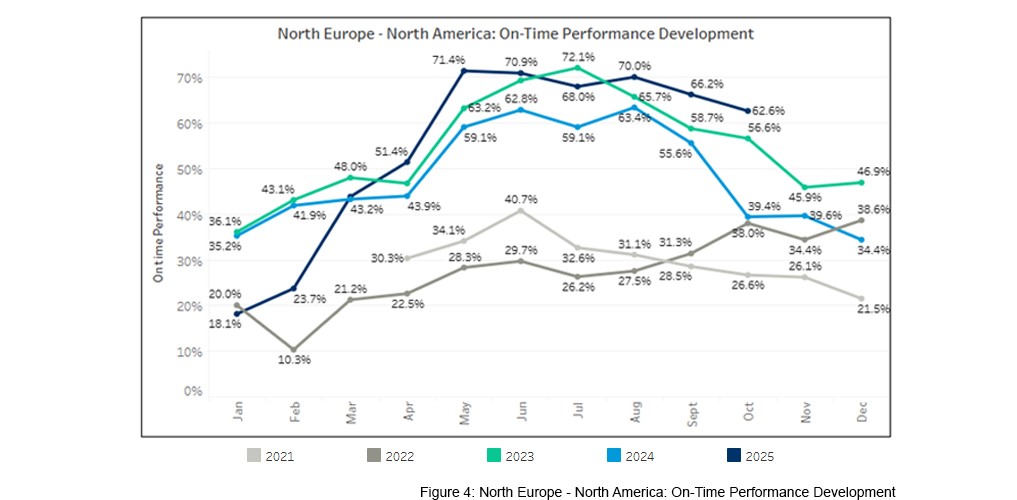
This decrease in reliability was accompanied by a rise in average arrival delays of LATE vessels, which increased from 2.9 days in June to 3.7 days by September. In October, LATE vessels arrived 3.1 days later than scheduled.
Despite these recent setbacks, both on-time performance and arrival delays in October remain improved compared to previous years.
Looking ahead, a trend of decreased reliability during the Northern Hemisphere winter months can be anticipated.
Eastbound
Schedule reliability for the eastbound Transatlantic route began the year at 28.7%, peaked at 73.5% in August, and then declined to 46.7% by October. 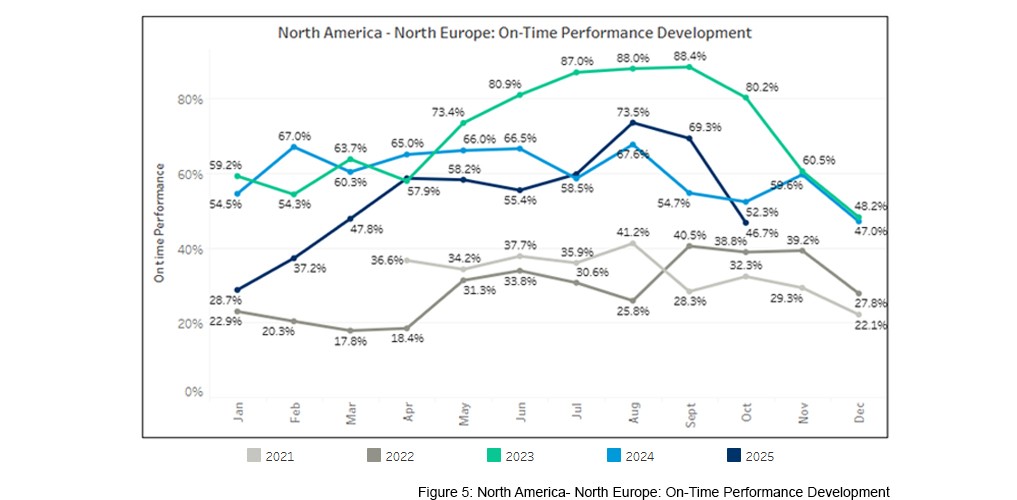
The average arrival delay of ALL vessels followed a similar trend, improving from 2.9 days in January to 1 day in September, before increasing to 2.2 days last month.
The average for LATE vessels increased from 3.3 days in September to 4.7 days in October, the highest delay for the year thus far.
Despite this decline in the second half of the year, both on-time performance and average arrival delays remained generally better than in previous years.
Methodology
Calculating the on-time performance
To calculate the on-time performance of a service, Kuehne+Nagel uses vessel schedules from carrier(s) offering that service. Only carrier schedules that match our quality criteria are used for the schedule reliability calculation.
As carriers update schedules constantly, they become more accurate the closer vessels get to a destination port. For this reason, we have implemented a "schedule freeze period" of 14 days prior to actual vessel arrival. In other words, we benchmark the actual arrival with what carriers last announced 14 days earlier. To identify the actual time of arrival, Kuehne+Nagel consumes AIS (Automatic Identification System) vessel data. All vessels that arrive within a +/- 24-hour window at the port of destination compared to the last announced arrival are considered to be on time. Port call omissions and blank sailings announced after the 14-day freeze are excluded from the calculation.
This report focuses exclusively on direct services. It does not account for overall container lead time reliability, which may be affected by additional delays arising from transhipment, intermodal transfers, port congestion, and other operational disruptions.
Assigning carrier services to multiple trade lanes
Many services operate on various trade lanes (e.g., a carrier service between Asia and North Europe also calls ports in the Middle East and or the Mediterranean), and therefore carrier services may be listed in multiple trade lanes.
Definition of trade lanes
There is no common standard for the definition of trade lanes. This means, depending on the source, you will find different trade lanes as well as different regions, countries and ports assigned to a trade lane. Kuehne+Nagel has defined its own way of mapping and has assigned ports to these trade lanes accordingly. On-time performances of vessels are captured in our reports on defined main trades, meaning trades moving large container volumes on vessels. Therefore, niche trades and services within one trade, called "Intra Trade" services (e.g. Intra-Asia, Intra-Europe), are currently out of scope.
A PDF version of this report can be found here.