- As a leader in sea logistics, Kuehne+Nagel closely tracks and collects data on the movement of vessels, including actual arrivals and vessel delays.
- A summary of this analysis, based on neutral data, is published monthly in our Schedule Reliability Report, available on Sea News.
Executive Summary
November 2025 reflected ongoing stability in global schedule reliability, holding firm at 53.0% and signalling incremental progress compared to the previous year.
Despite this steady performance, previous years suggest a potential decline in reliability for December.
Trade lane reliability varied across regions. The Mediterranean/Black Sea ↔ North America route demonstrated the strongest improvement, reaching 72.0%.
In contrast, the Asia ↔ North America trade lane experienced the largest decline, dropping to 53.5%. North America ↔ South America remained the most reliable trade lane at 78.6%, followed by Mediterranean/Black Sea ↔ South America at 73.4%.
Operationally, the average delay for LATE vessels improved slightly to 3.7 days, while the average delay for ALL vessels remained constant at 1.6 days.
These figures reflect ongoing efforts to stabilise performance despite persistent challenges, such as port congestion, transhipment delays, and other disruptions.
Featured trade lane
This month’s report highlights the Mediterranean/Black Sea ↔ North America trade lane, which showed the most significant improvement in reliability.
In November, reliability on this route rose by 5.7 percentage points to reach 72.0%, marking a substantial year-over-year gain of 26.9 percentage points.
The average delays for LATE vessels and ALL vessels were 3.1 days and 1 day, respectively. Carrier reliability varied between 40% to 84.6%
Insights into individual leg performance can be found on the following pages.
Global On-Time Performance
Global schedule reliability for November remained steady at 53.0%, showing no change from October’s result.
Compared to November 2024, this represents a modest year-on-year improvement.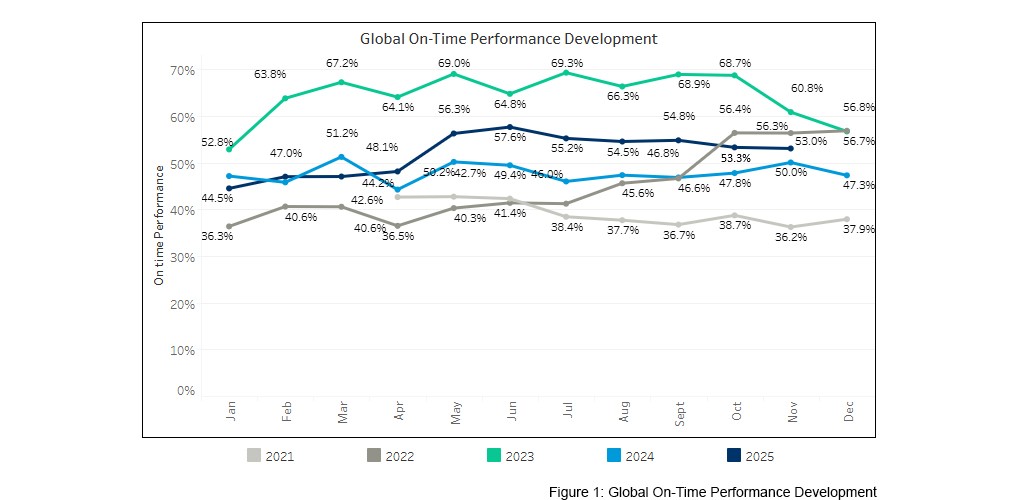 Based on the trends illustrated in the accompanying graph, a decrease in overall reliability is anticipated for December.
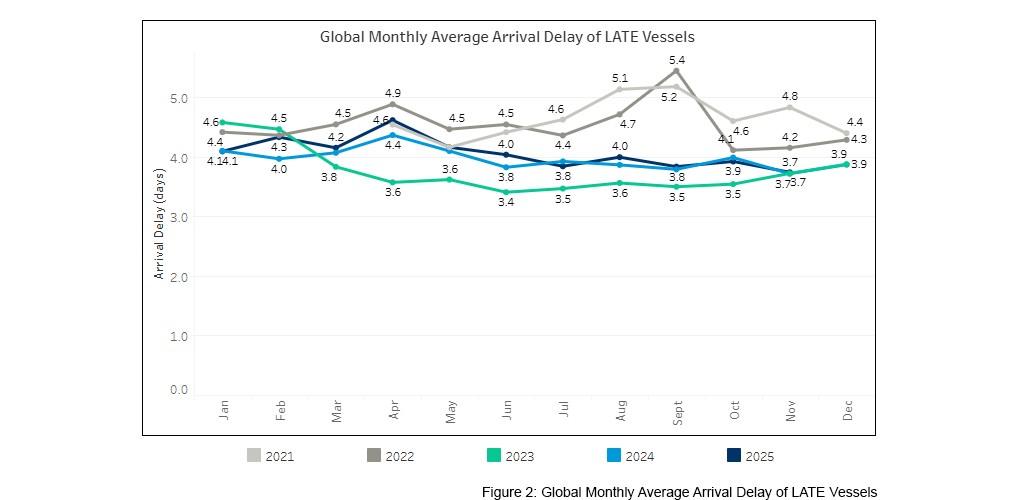 In November, the average delay for LATE vessels improved slightly to 3.7 days.
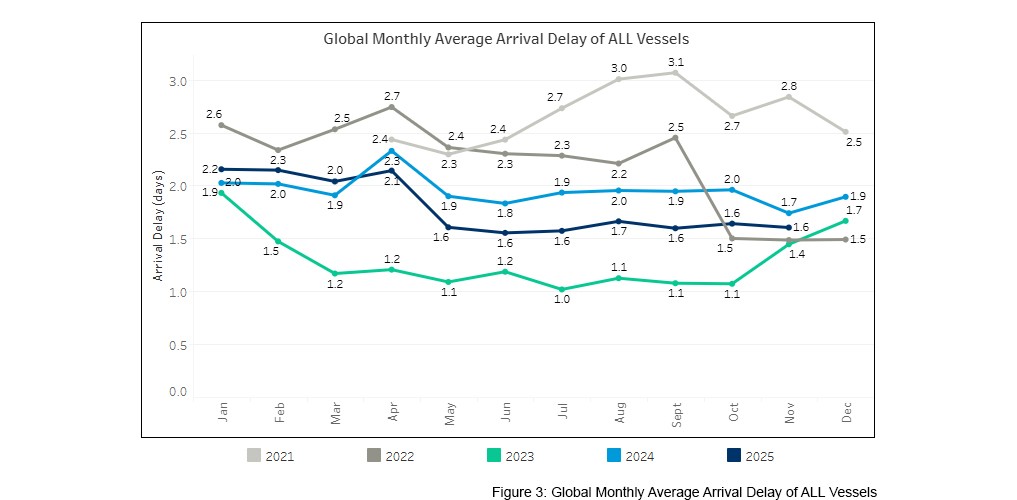 Meanwhile, the average delay for ALL vessels held constant at 1.6 days, indicating stable performance month-on-month.
Reliability per Trade Lane
Trade lane performance in November exhibited a range of changes, with results varying from a 5.2 percentage point decrease to a 5.3 percentage point increase.
The most significant improvement was observed on the Mediterranean/Black Sea ↔ North America route, which reached a reliability rate of 72.0%. In contrast, the Asia ↔ North America trade lane experienced the largest decline, dropping to 53.5%.
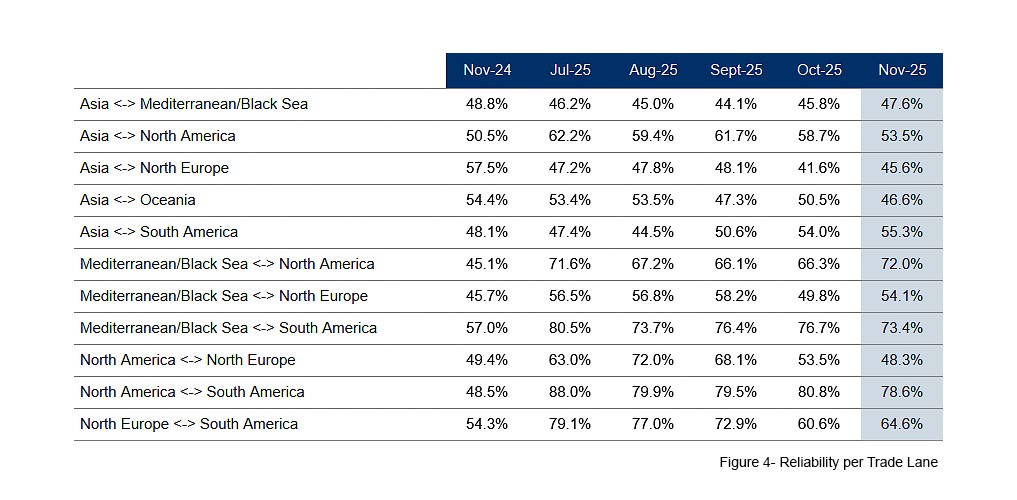
Despite these shifts, the North America ↔ South America trade lane remained the best-performing, achieving a reliability rate of 78.6%, followed by the Mediterranean/Black Sea ↔ South America route at 73.4%.
As indicated in the table above, four trade lanes continue to report reliability rates below the 50% threshold.
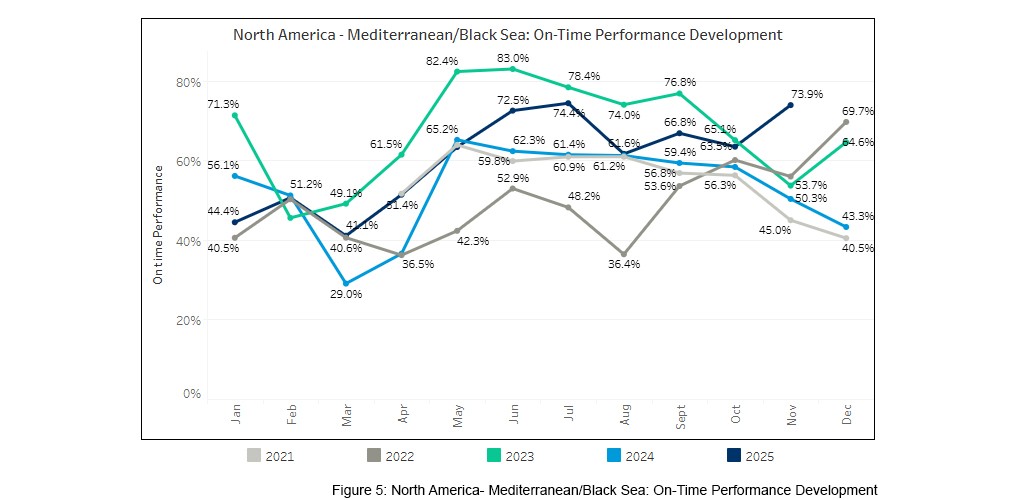
Reliability on Mediterranean/Black Sea ↔ North America
Last month, our analysis focused on the transatlantic trade between North Europe and North America. This month, attention shifts to the Mediterranean/Black Sea to and from North America, a closely related trade lane.
In November, this route demonstrated the most significant improvement, rising by 5.7 percentage points to reach a reliability rate of 72.0%. This marks a substantial year-on-year gain of 26.9 percentage points.
Average delays for LATE vessels and ALL vessels on this trade were 3.1 days and 1 day, respectively. In November, carrier reliability ranged from 40% to 84.6%.
Headhaul
On-time performance on the headhaul direction showed remarkable progress throughout 2025.
Starting from a low reliability of 26.2%, the trade lane steadily improved, reaching a peak of 81.7% in June before fluctuating between 75.5% and 65.2% in the following months.
In November, reliability was measured at 68.8%, representing a substantial increase of 35.0 percentage points compared to November 2024.

During 2025, the average delay for LATE vessels varied month to month, averaging 3.0 days, while the average delay for ALL vessels was consistently around 1 day.
Carrier reliability on this route ranged from 42.9% to 86.2%
Backhaul
On the backhaul direction, reliability improved from 44.4% in January to 73.9% in November.
Overall, performance in 2025 surpassed that of 2024; however, it did not reach the levels observed in 2023. Notably, November was the first month in which reliability exceeded both 2024 and 2025 figures.
In November, LATE and ALL vessels on the backhaul experienced delays similar to those seen on the headhaul direction.
Carrier reliability on this leg ranged from 33.3% to 83.5%.
Methodology
Calculating the on-time performance
To calculate the on-time performance of a service, Kuehne+Nagel uses vessel schedules from carrier(s) offering that service. Only carrier schedules that match our quality criteria are used for the schedule reliability calculation.
As carriers update schedules constantly, they become more accurate the closer vessels get to a destination port. For this reason, we have implemented a "schedule freeze period" of 14 days prior to actual vessel arrival. In other words, we benchmark the actual arrival with what carriers last announced 14 days earlier. To identify the actual time of arrival, Kuehne+Nagel consumes AIS (Automatic Identification System) vessel data. All vessels which arrive within a +/- 24-hour window at the port of destination compared to the last announced arrival are considered to be on time. Port call omissions and blank sailings announced after the 14-day freeze are excluded from the calculation.
Assigning carrier services to multiple trade lanes
Many services operate on various trade lanes (e.g. a carrier service between Asia and North Europe also calls ports in the Middle East and or the Mediterranean), and therefore carrier services may be listed in multiple trade lanes.
Definition of trade lanes
There is no common standard for the definition of trade lanes. This means, depending on the source, you will find different trade lanes as well as different regions, countries and ports assigned to a trade lane. Kuehne+Nagel has defined its own way of mapping and has assigned ports to these trade lanes accordingly. On-time performances of vessels are captured in our reports on defined main trades, meaning trades moving large container volumes on vessels. Therefore, niche trades and services within one trade, called "Intra Trade" services (e.g. Intra-Asia, Intra-Europe), are currently out of scope.
A PDF version of this report can be found here.