
Global container freight rates are a fundamental aspect of international logistics, influencing the cost and competitiveness of shipping goods worldwide.
Various factors,including fuel prices, supply and demand dynamics, port congestion, and geopolitical events, determine these rates.
With multiple major east–west and regional trade lanes in operation, monitoring freight rate movements across global markets can be complex.
To address this challenge, container freight indices were created to provide a standardised benchmark for comparing freight rates across key routes.
In this article, we explain what container freight indices are, how they are calculated, and the insights they offer to logistics customers.
Global freight indices and their purpose
Global freight indices are benchmarks that track the cost of shipping containerised cargo across selected trade lanes over time.
As shown in the graph below, indices record fluctuations and trends in container freight rates, helping users understand how market conditions have changed historically and how they are evolving in the current market.
Beyond serving as benchmarks, freight indices can also act as economic indicators, offering insight into the overall health of global trade.
For example, a sustained upward trend may reflect strong demand, capacity constraints, or operational disruptions, while a downward trend may indicate weaker demand or excess vessel capacity.
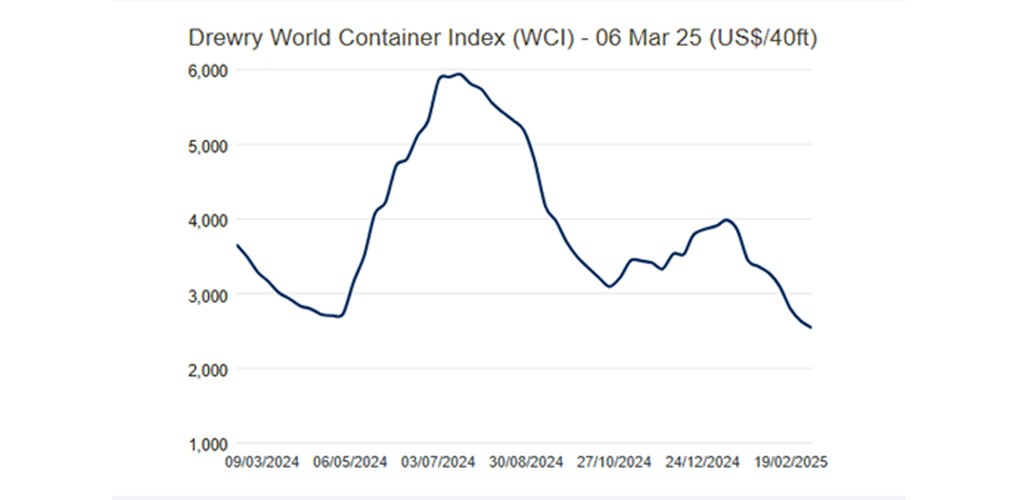
For instance, rate increases observed during July–August 2024 on several major trade lanes were driven by a combination of port congestion, reduced vessel availability, and cargo being shipped earlier than usual to mitigate anticipated delays.
By monitoring relevant container freight indices, shippers can gain early visibility of rising or falling rate environments, helping them manage cost exposure and prepare for contract negotiations.
Key components of container freight indices
To understand container freight indices, it is important to consider their core components: the trade lanes they cover, the data (rate) contributors, and the cost elements included in the index calculation.
Trade lanes
The most widely used indices cover between 8 and 15 major shipping routes, including the Asia–North America, Asia–North Europe, and Europe–North America routes.
These routes account for a significant share of global containerised trade and provide a representative view of overall market trends.
Data contributors
Freight rate data is collected from a range of market participants, including shippers, liner shipping companies, non-vessel-operating common carriers (NVOCCs), and freight forwarders.
Rates are aggregated and anonymised to ensure individual commercial agreements remain confidential.
Costs included
Rates used in container freight indices are typically based on either Freight of All Kinds (FAK) cargo or spot market prices for a forty-foot equivalent unit (FEU).
To ensure indices reflect current market conditions, only short-term or spot rates are considered. These rates usually cover port-to-port transportation costs (container yard to container yard, or CY–CY) and exclude origin and destination local charges such as customs clearance or inland transport.
Terminal Handling Charges (THC) may be included or excluded depending on the index provider and prevailing market practices on individual trade lanes. As methodologies differ, users should review index definitions before making direct comparisons.
How are container freight indices calculated?
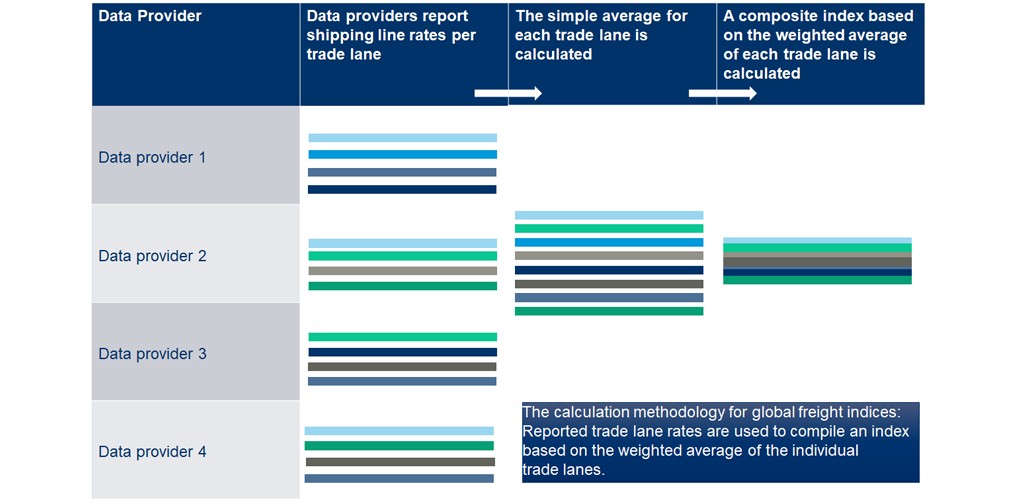
Container freight indices are typically published as composite indices, which combine freight rates from multiple trade lanes into a single reference value in points.
The process begins by collecting shipping line rates for various trade lanes from multiple data providers on a daily or weekly basis.
Next, a simple average is calculated for each individual trade lane.
These trade lane-level averages are then combined into a composite index using weighted averages.
The weightings are typically based on estimated trade volumes or the relative importance of each trade lane.
Shippers and carriers can use these composite indices as benchmarks to assess whether their spot orcontracted rates are broadly aligned with prevailing market conditions.
The most popular container freight indices
Some of the most widely recognised container freight indices include the Drewry World Container Index (WCI), the Freightos Baltic Index (FBX), the Shanghai Containerised Freight Index (SCFI), and the Xeneta Shipping Index.
Each index differs in its data sources, trade lane coverage, and calculation methodology. For example, the SCFI focuses on spot export rates from Shanghai, while the WCI and FBX provide broader global coverage through composite indices.
The most relevant index to follow depends on the trade lanes a shipper uses. For shipments originating in China, the Shanghai Containerised Freight Index may be particularly relevant, while shippers with diversified global volumes may benefit from tracking global composite indices.
Nevertheless, on key lanes, most indices do correlate very closely with one another.
Conclusion: Using freight indices as a logistics customer
Container freight indices are valuable tools for navigating volatile shipping markets. While they do not predict future rates, they provide transparency into current pricing conditions and recent market developments.
For logistics customers, freight indices can be used to:
- Benchmark freight rates against the broader market
- Support budgeting and cost planning
- Strengthen positions in contract and surcharge negotiations
- Identify periods of market tightening or easing
When combined with internal shipment data and broader market intelligence, container freight indices support more informed, data-driven logistics and procurement decisions.