
A QUARTER of the way into the 21st century, the container port rankings offer a striking snapshot of how profoundly global trade has changed. Few at the turn of the millennium would have predicted the scale of the transformation that followed.
When Lloyd’s List’s annual tally of the world’s largest container ports entered the new century, Hong Kong topped the table, Shanghai ranked sixth with just 5.6m teu and Ningbo-Zhoushan was little more than a footnote in the global hierarchy.
Container shipping was entering an era of accelerating globalisation, China’s manufacturing boom was only beginning to gather momentum and supply chains were becoming increasingly integrated across continents. By 2025, Shanghai had grown tenfold to 55m teu, Ningbo-Zhoushan had become the world’s third-largest port and China occupied five of the top eight positions in the rankings. Throughput across the top 20 ports quadrupled from 109m teu to more than 440m teu over the period.
Looking back over the first quarter of the century, the rankings chart far more than cargo growth. They tell the story of China’s industrial rise, Asia’s emergence as the centre of global manufacturing, ever-larger vessels and the concentration of cargo in a handful of strategic hubs. They also reflect a succession of shocks, from the financial crisis and US-China trade war to the pandemic, Russia’s invasion of Ukraine and Red Sea disruption, that repeatedly reshaped global trade flows.
The growth story, however, was never linear. The rise of China, mega-vessels, carrier alliances and terminal operator consolidation transformed the competitive landscape, while automation, digitalisation and decarbonisation changed how ports operate.
If there is one defining theme of the past 25 years, however, it is the extraordinary concentration of global container activity in Asia.
Container ports spent much of the period adapting to a succession of structural shifts and unexpected shocks that repeatedly altered cargo flows. The rise of China, the development of mega-vessels, the emergence of global carrier alliances and the consolidation of terminal operators all transformed the competitive landscape. More recently, the financial crisis, the US-China trade war, the pandemic, Russia’s invasion of Ukraine and the disruption of Red Sea shipping have each left a visible imprint on the rankings. Meanwhile, automation, digitalisation and decarbonisation have fundamentally altered how ports operate.
However, if there is a single defining theme of the past 25 years it is the extraordinary concentration of global container activity in Asia.
In 2000, Asian ports accounted for around 65% of throughput among the world’s 20 largest gateways. By 2025 that figure exceeded 85%, with 15 Asian ports occupying the top 20 places. The shift reflects not simply the rise of China but the emergence of an integrated Asian manufacturing and logistics ecosystem stretching from northeast Asia through southeast Asia and increasingly into South Asia.
China’s accession to the World Trade Organization in 2001 proved the catalyst. Manufacturing migrated inland and along the coast at unprecedented speed, creating enormous cargo concentrations around the Yangtze River Delta, Pearl River Delta and Bohai Rim. Shanghai grew from 5.6m teu in 2000 to 18m teu by 2005 and almost 30m teu by 2010, when it overtook Singapore to become the world’s largest container port. Qingdao, Ningbo-Zhoushan, Shenzhen, Guangzhou and Tianjin followed similar trajectories as successive waves of industrial investment generated cargo volumes on a scale previously unseen.
Bigger ships, fewer hubs
The industry’s pursuit of economies of scale amplified those gains.
As vessel sizes increased from a few thousand teu to ships capable of carrying more than 24,000 teu, carriers consolidated calls into a smaller number of ports capable of handling the largest vessels. Hub-and-spoke networks intensified, concentrating cargo into major gateways while strengthening the position of strategic transhipment hubs.
Singapore remained the clearest beneficiary. Despite surrendering top spot to Shanghai, the city-state reinforced its position as the world’s leading transhipment hub, growing from 17m teu in 2000 to almost 45m teu in 2025. Port Klang and Tanjung Pelepas similarly leveraged their strategic position on the Malacca Strait, while Dubai emerged as the dominant hub connecting Asia, Europe, Africa and the Middle East.
But as cargo concentrated in a handful of mega-hubs, the reshaping of global trade routes also altered the fortunes of several long-established gateways.
Hong Kong’s decline illustrates perhaps the most significant competitive shift of the period. The port remained one of the world’s premier gateways at the start of the century, handling 18.1m teu in 2000 and more than 23m teu as recently as 2010. Yet as Shenzhen and Guangzhou expanded and mainland infrastructure improved, cargo increasingly bypassed Hong Kong altogether. By 2025 the port had fallen to 14th place, handling just under 13m teu.
Taiwan’s Kaohsiung and several Japanese gateways experienced similar relative declines. They remained substantial container ports, but they could not match the growth rates being generated elsewhere in Asia.
When the unexpected became normal
The global financial crisis provided the first major interruption to what had otherwise been a period of relentless expansion.
After years of double-digit growth, throughput among the world’s leading container ports contracted sharply in 2009 as consumer demand collapsed across Europe and North America. Several ports lost volumes for the first time in decades. Yet the downturn proved relatively short-lived. Massive Chinese stimulus programmes helped revive trade flows and by 2010 container shipping had largely returned to growth.
A more consequential shock emerged a decade later.
The US-China trade war that began in 2018 marked the first serious challenge to many of the assumptions that had underpinned globalisation since China’s accession to the World Trade Organization nearly two decades earlier.
For much of the 2000s and early 2010s, supply chains had been built around efficiency, scale and cost. China sat at the centre of that model. Tariffs changed the conversation. While few manufacturers abandoned China altogether, many began pursuing a “China Plus One” strategy, adding production capacity elsewhere in Asia to reduce risk and lessen dependence on a single country.
What began as a response to trade tensions subsequently evolved into a broader corporate strategy encompassing supply chain resilience, geopolitical risk and market access. Investors and manufacturers increasingly looked towards Vietnam, India and other emerging production centres as alternative locations for export-oriented manufacturing.
The impact was gradual rather than immediate, but it helped reshape the geography of container trade. Ports serving these emerging manufacturing hubs began attracting new services, fresh investment and greater strategic importance within east-west shipping networks. Vietnam’s gateways, including Ho Chi Minh City, Hai Phong and Cai Mep, emerged among the most notable beneficiaries, while India’s leading container ports also strengthened their position as multinational companies diversified sourcing and production footprints across Asia.
The process accelerated further following the pandemic, which reinforced concerns over supply chain concentration and encouraged policymakers and businesses alike to prioritise resilience alongside efficiency. Taken together, the trade war and the global pandemic may ultimately be remembered as the catalysts that began the slow reordering of manufacturing networks that had previously revolved overwhelmingly around China.
The age of disruption
Then came the industry’s most disruptive black swan event.
The pandemic exposed the fragility of modern container supply chains on an unprecedented scale. Lockdowns, labour shortages and shifting consumer spending patterns triggered congestion from Los Angeles to Shanghai. Vessel queues stretched for weeks. Freight rates reached record highs. The just-in-time model that had underpinned supply chains for decades suddenly appeared vulnerable.
Yet the remarkable feature of the pandemic was not that port volumes collapsed, but that they continued rising. As governments unleashed fiscal stimulus and consumers redirected spending from services to goods, container demand surged. Throughput at major ports recovered rapidly and by 2021 many gateways were handling record volumes despite severe operational disruption.
The post-pandemic years delivered another reminder of how quickly maritime trade patterns can change.
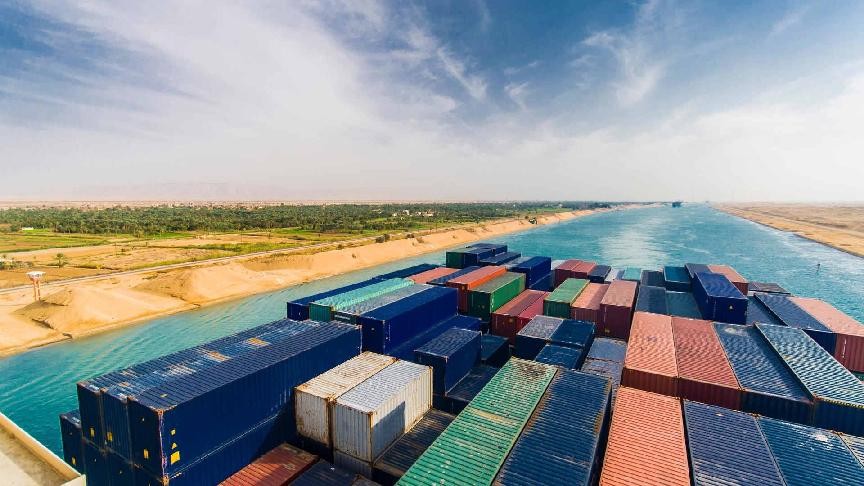
Russia’s invasion of Ukraine in 2022 disrupted Black Sea trade and accelerated geopolitical fragmentation. The Red Sea crisis that followed forced many ships away from the Suez Canal and around the Cape of Good Hope, reshaping network patterns and generating unexpected gains for several Mediterranean and Middle Eastern hubs. Ports including Jeddah, Port Said and Tanger Med benefited from changes to routing and transhipment patterns, while carriers were forced once again to redesign networks around an external shock.
A more uncertain future
By 2025 the industry had entered a very different era from the one it occupied at the beginning of the century.
Container ports are more automated, more technologically sophisticated and more environmentally conscious. They are also more exposed than ever to geopolitical tensions, supply-chain disruption and changing trade policies. The concentration of cargo into fewer, larger gateways has created enormous efficiency gains but also increased systemic vulnerability when disruptions occur.
What the rankings ultimately reveal is that ports do not grow simply because ships call there. They prosper when they sit at the centre of the economic, political and supply-chain forces shaping global trade. Over the past 25 years those forces have included China’s rise as the world’s manufacturing powerhouse, the deployment of ever larger vessels, the consolidation of liner shipping and a succession of black swan events that repeatedly challenged conventional assumptions about globalisation.
If the first quarter of the century belonged to China, the next may be defined by the wider Asian manufacturing ecosystem that has emerged around it. While Chinese ports continue to dominate the upper reaches of the rankings, the rapid ascent of gateways in Vietnam, Malaysia, India and elsewhere in southeast Asia points to a gradual rebalancing of global supply chains as manufacturers pursue diversification, resilience and market access alongside scale and efficiency.
Vietnam’s rise from manufacturing outpost to major export hub has been among the most striking developments of recent years, while India is increasingly positioning itself as an alternative production base for multinational companies. Around them, a network of ports stretching from Singapore and Port Klang to Cai Mep, Hai Phong and Mundra is becoming ever more integral to global container trade.
Growth is not confined to Asia. Across Africa, rising populations, urbanisation and consumer demand are driving investment in ports and logistics infrastructure. Gateways including Tema, Lomé, Abidjan, Dar es Salaam and Mombasa are strengthening their positions, while Tanger Med continues to expand its role linking Europe, Africa and major east-west trade routes.
The Middle East is following a similar path, leveraging its strategic location to develop sophisticated logistics, manufacturing and transhipment hubs. The lesson of the past 25 years is that port rankings are never static; they reflect where investment, manufacturing and trade are heading next.