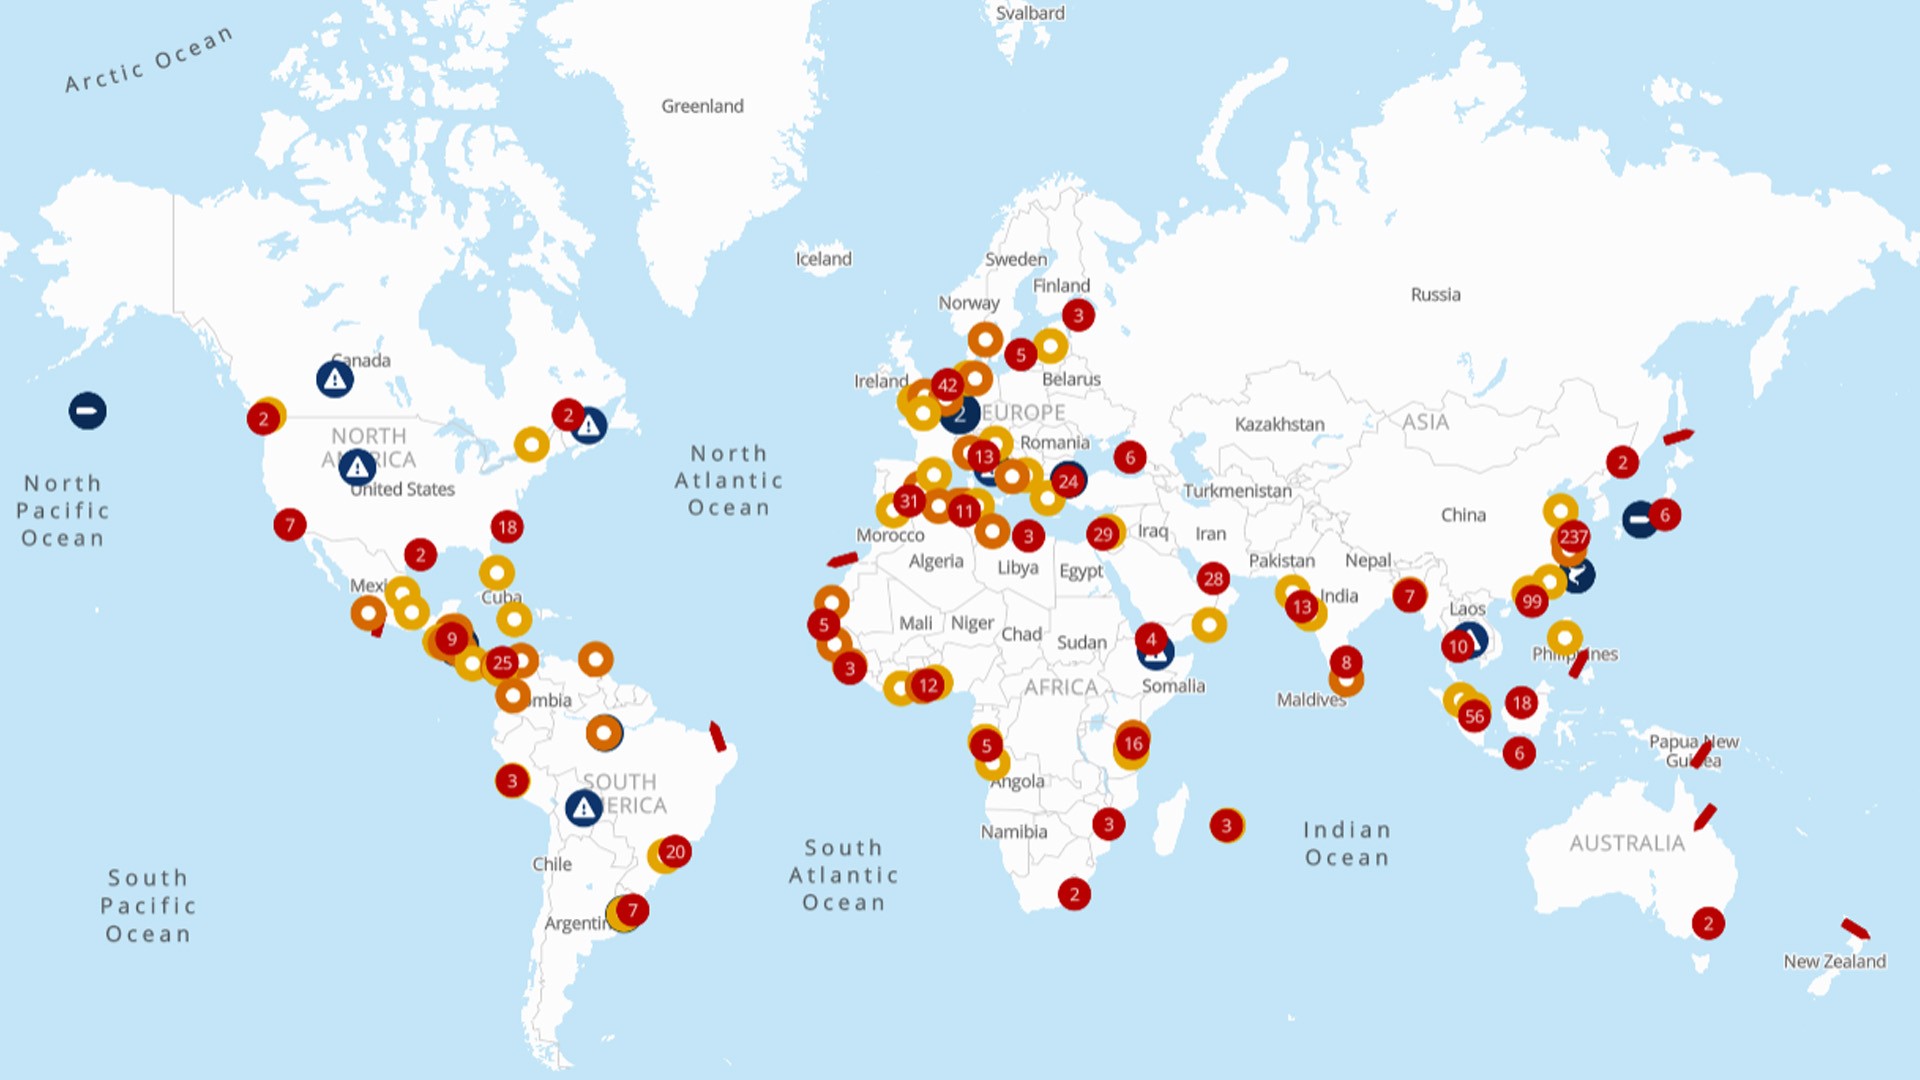

Stay ahead of supply chain disruptions and port congestion with Kuehne+Nagel’s weekly port operational update.
- Find out the latest vessel waiting times and status of ports in Africa, Asia Oceania, Europe, Middle East-Indian Subcontinent, North America, and South and Central America.
Africa
Benin
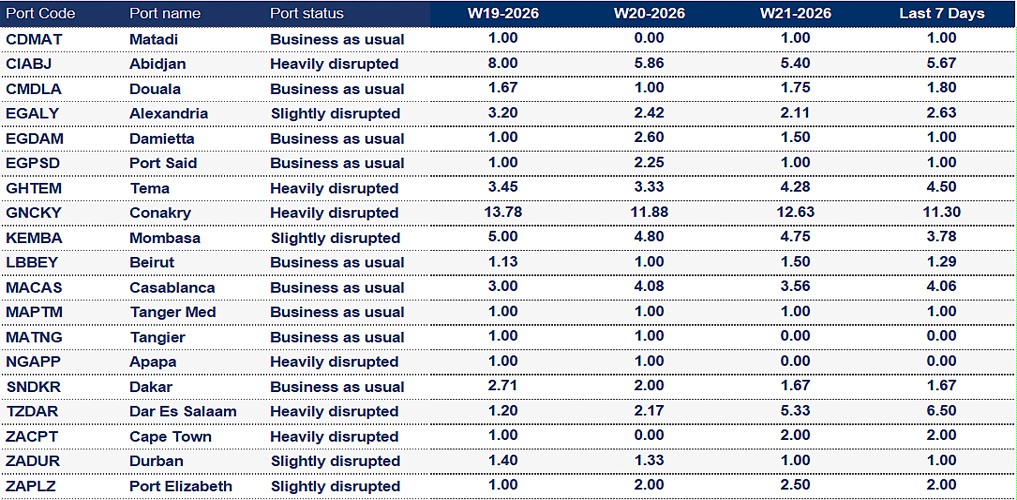
Cotonou: The 7-day average vessel waiting time is around 4.89 days.
Ghana
Tema: The 7-day average vessel waiting time is around 4.5 days. Berth constraints, crane outages, and yard congestion are impacting vessel berthing schedules, resulting in delays to berthing times.
Guinea
Conakry: The 7-day average vessel waiting time is around 11.3 days. Severe congestion with long vessel waiting times, limited storage capacity and insufficient empty containers; mitigation measures include continuous truck circulation.
Ivory Coast
Abidjan: The 7-day average vessel waiting time is around 5.67 days. High yard utilisation and congestion, combined with road congestion, are adversely impacting gate operations. There is a high risk of scheduling delays, with potential knock-on disruptions affecting inland transport corridors.
Kenya
Mombasa: The 7-day average vessel waiting time is around 3.78 days. Long-term terminal congestion persists, with reduced productivity driven by equipment shortages and high transshipment volumes into hinterland markets. Vessel bunching and off-window arrivals are reported, alongside ongoing empty container imbalances.
Mauritius
Port Louis: Cloudy conditions with intermittent rain and strong wind gusts have been experienced, which may result in operational disruptions.
Mozambique
Beira: The 7-day average vessel waiting time is around 12.2 days. Terminal recovery is anticipated by weeks 32–33. Intermittent wind gusts and rain are expected to persist throughout the remainder of the week, with a potential impact on operations.
Nigeria
Apapa: Severe road congestion and truck queuing remain key bottlenecks. Berthing delays are expected, with short-notice schedule changes likely.
Tincan/Lagos: Delays are being driven by a build-up of empty containers and intermittent gate closures, impacting terminal operations and overall flow.
South Africa
Cape Town: The 7-day average vessel waiting time is around 2.0 days. Strong winds are experienced at the beginning of the week; however, weather conditions are generally expected to remain clear for the remainder of the period and into the weekend. CTCT: Carrier and service allocations may vary depending on berthing windows. As vessels may experience delays at previous port calls, it is recommended to closely monitor Transnet schedules for any changes.
Port Elizabeth: The 7-day average vessel waiting time is around 2.0 days. Inclement weather was experienced mid-week; however, conditions are expected to remain clear for the remainder of the period and into the weekend. NCT 1–5. Some carriers are reporting berthing delays of up to 7 days. Improvements are anticipated with the expected clear weather over the weekend.
Tanzania
Dar Es Salaam: The 7-day average vessel waiting time is around 6.5 days. Terminal gate and road congestion are causing delays to container movements. Challenges with berth sequencing persist, while ongoing vessel diversions to Mombasa continue to exacerbate congestion across the region.
Asia Oceania
China
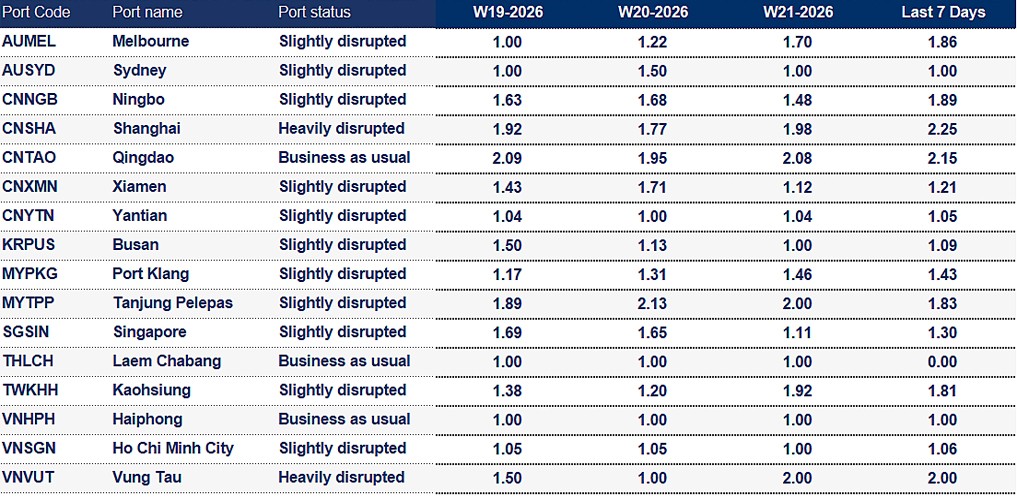
Ningbo: The 7-day average vessel waiting time is around 1.89 days. Recent dense fog caused terminal closures. Average waiting times have improved to around 1.0 days at YZCT and MSICT.
Shanghai: The 7-day average vessel waiting time is around 2.25 days. WGQ2 waiting times remained at 1.5–2 days this week, driven by concentrated arrivals of mainline vessels, feeders and barges. WGQ5 remained stable at around 1 day, with congestion easing. YGS12 averaged 0.5 days but is expected to increase to 1–1.5 days due to clustered arrivals. Foggy conditions occurred between 22 and 23 May.
Japan
Yokohama: The 7-day average vessel waiting time is around 1.33 days. YOK D5 operations remained stable in Week 21 with no major congestion. However, a notable deterioration is expected next week, with waiting times likely to increase to approximately 1–1.5 days, driven by higher vessel volumes and arrival clustering.
Malaysia
Tanjung Pelepas: The 7-day average vessel waiting time is around 1.83 days. Berthing conditions remain fluid, with congestion expected to fluctuate. For Weeks 21–22, 120 metres of berth are blocked until 31 May for quay crane installation, which is likely to increase waiting times at the lower berth. Additional crane commissioning is ongoing until the end of this week. Furthermore, 120 metres on Berth 10 are unavailable due to dredging works.
Philippines
Manila: The 7-day average vessel waiting time is around 4.56 days. Heavy berth congestion persists at Manila North. Off-window vessels continue to experience significant disruptions, with average waiting times and delays generally exceeding five days due to limited berth availability and sustained operational pressure.
Singapore
Singapore: The 7-day average vessel waiting time is around 1.3 days. PSA terminals remain busy, with general waiting times exceeding one day across carriers. Yard utilisation is stable at around 80%, supporting overall operational performance.
South Korea
Busan: The 7-day average vessel waiting time is around 1.09 days. At BNCT, laden yard density is approximately 65%. Overall conditions in Week 21 remain stable with no major congestion. However, the situation may remain dynamic due to volatile vessel arrival times and the risk of vessel bunching in Busan.
Europe
Belgium
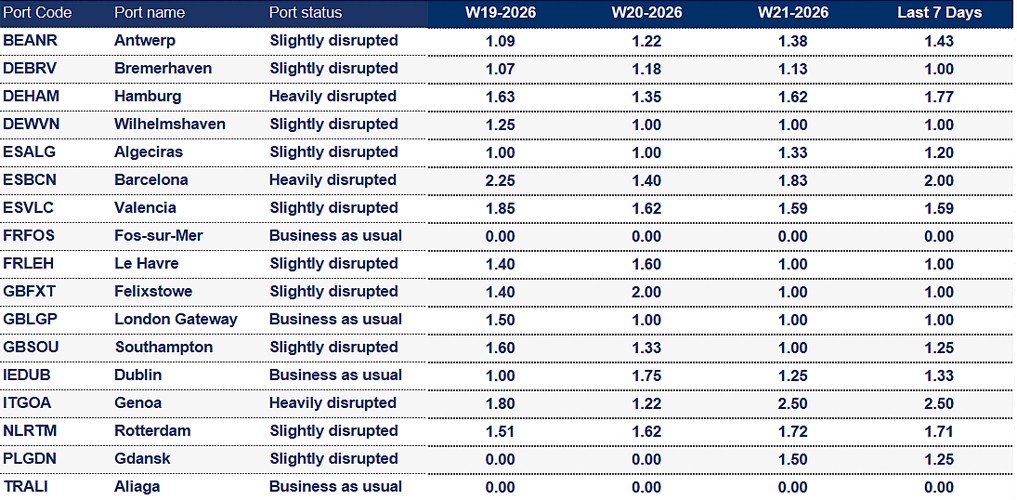
Antwerp: The 7-day average vessel waiting time is around 1.43 days. Occasional delays were experienced over the past weekend due to a shortage of sea and river pilots.
Germany
Bremerhaven: The 7-day average vessel waiting time is around 1 day. Yard occupancy stands at 92% and remains manageable; however, conatiner slots for dangerous goods are constrained.
Hamburg: The 7-day average vessel waiting time is around 1.77 days. Following a shunting incident at Hamburg Waltershof, access to and from the CTA terminal is currently completely blocked. Yard occupancy remains high at CTA (89%) and CTH (86%). At CTA, limited crane availability at Berth 1 and ongoing construction require feeders to be handled between mainliners, placing pressure on the vessel line-up. The post-Pentecost period is expected to be tight, with delays anticipated. CTH operations remain stable, with the programme executed as planned.
Wilhelmshaven: The 7-day average vessel waiting time is around 1 day. Yard density remains at around 80% and is under control. An IMO incident last Wednesday caused a full terminal stoppage for approximately two hours, resulting in an additional backlog of around 350 moves ahead of the pre‑Pentecost closure.
Italy
Netherlands
Rotterdam: The 7-day average vessel waiting time is around 1.71 days. ECT: Yard occupancy remains stable at 77%, with 40’ positions reaching 84%. Reefer capacity is stable, and gang availability remains sufficient. Barge delays range from 0–24 hours, while feeder delays of 36–48 hours are reported due to mainliners occupying feeder berths. Reduced crane availability is impacting productivity and putting pressure on sailing deadlines. NL/MVII: Yard occupancy stands at 90%. Units containing dangerous goods in the yard remain at elevated levels.
Middle East - Indian Subcontinent
Middle East:
India
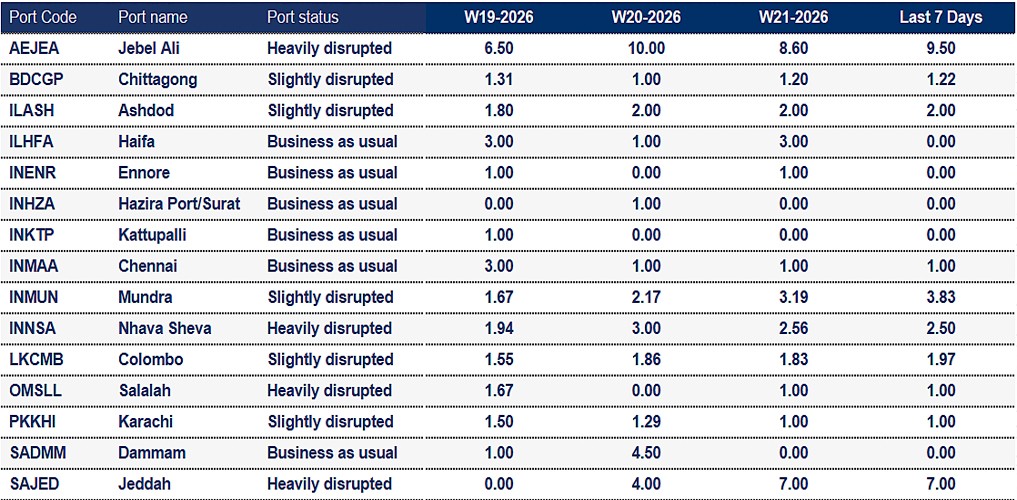
Mundra: The 7-day average vessel waiting time is around 3.83 days. The Middle East crisis has redirected significant container volumes into Indian ports. Increased terminal dwell times and high yard density. Carrier scheduling is erratic, and some delays are being experienced, besides gate closures and yard congestion. Additionally, there is a risk of fuel shortages.
Nhava Sheva: The 7-day average vessel waiting time is around 2.5 days. The port is handling increased volumes driven by Middle East disruptions, vessel re-routings, and schedule changes. High terminal dwell times and yard density persist. Road congestion and gate delays are reported. Landside operations remain under severe strain, with shortages of truck drivers and terminal constraints further exacerbating congestion and delays.
Pakistan
Karachi: The 7-day average vessel waiting time is around 1 day. A significant surge in volume has been reported due to the Middle East crisis, with the port emerging as an alternative hub. Terminal capacity remains limited under rapid growth, increasing the risk of further congestion.
Sri Lanka
Colombo: The 7-day average vessel waiting time is around 2.0 days. Increased transshipment volumes and vessel activity are being experienced. Terminal congestion and inter-terminal transfer delays persist. There is an elevated risk of vessels bypassing the port due to congestion spikes.
North America
Canada
Average import rail dwell time for Canadian cargo (Vessel arrival to departure rail ramp):
- Halifax: 5 days
- Montreal: 5 days
- Prince Rupert: 8 days
- Saint John: 5 days
- Vancouver: 6 days
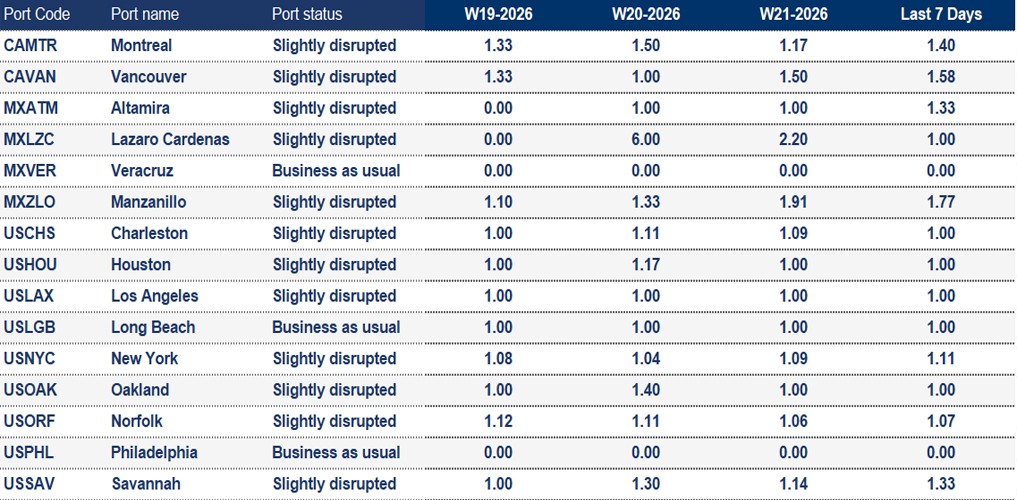
Montreal: The 7-day average vessel waiting time is around 1.4 days. The average rail dwell time is around 5 days. Yard utilisation remains high but stable, while rail car availability has improved, supporting more consistent inland operations.
Vancouver: The 7-day average vessel waiting time is around 1.58 days. The average rail dwell time is around 6 days. Yard utilisation remains high, with elevated ground counts, while rail car availability is strong. Berth delays have shown significant improvement.
United States
Average import rail dwell time for American cargo (Vessel arrival to departure rail ramp):
- Halifax - 12 days
- Montreal - 9 days
- Prince Rupert - 9 days
- Vancouver - 6 days
- Saint-John - 8 days
- Charleston - 3 days
- Newark - 4 days
- Houston - 8 days
- Jacksonville - 3 days
- Los Angeles - 5 days
- Long Beach - 8 days
- New York - 5 days
- Miami - 1 day
- Oakland - 5 days
- Norfolk - 3 days
- Philadelphia - 10 days
- Savannah - 2 days
- Seattle - 4 days
- Tacoma - 4 days
Los Angeles: The 7-day average vessel waiting time is around 1 day. Drayage delays and extended gate turn times are impacting trucking productivity and overall landside efficiency.
New York: The 7-day average vessel waiting time is around 1.11 days. Carrier schedules remain erratic, with ongoing vessel bunching. Slipped and cascading schedules are being observed across the USA–ZA–USA trade.
Savannah: The 7-day average vessel waiting time is around 1.33 days. Increased volumes are being experienced due to cargo diversions from the West Coast and global routing changes. Rail congestion and drayage constraints are also being reported.
South and Central America
Brazil
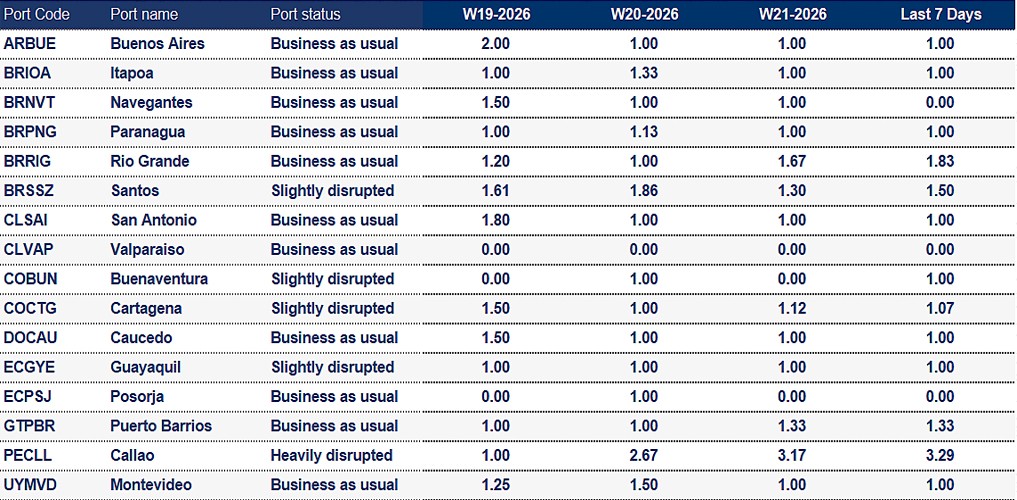
Santos: The 7-day average vessel waiting time is around 1.5 days. Cape of Good Hope diversions have disrupted arrival patterns across South America, resulting in off-window vessel calls and increased berth congestion.
El Salvador
Acajutla: The 7-day average vessel waiting time is around 2.5 days.
Peru
Callao: The 7-day average vessel waiting time is around 3.29 days.
How Kuehne+Nagel estimates port disruption statuses
Seaexplorer has four port statuses that are estimated based mainly on the 7-day average vessel waiting time. Other factors include yard congestion, labour strikes, natural disasters or intermodal disruptions. Slightly different rules are applied to major ports, or ports that are hubs in their region, as they are typically more efficient.
- Business as usual means the port is currently operating without any significant disruption.
- Slightly disrupted is used if the 7-day average vessel waiting time exceeds 2 days.
- Heavily disrupted is used if the 7-day average vessel waiting time exceeds 4 days.
- Port closed is used when the port suspends operations due to a major disruptive event.
How Kuehne+Nagel calculates the 7-day average vessel waiting time
Mainline container vessels may spend a certain number of days waiting at designated anchorage areas before their scheduled port call.
To calculate the 7-day average waiting time, we consider the waiting days of these vessels, excluding:
- Waiting times for feeder vessels,
- Idle ships without an announced next port,
- Slow steamers heading toward the anchorage, but not actively waiting within the designated area
- Vessels passing through the anchorage area without intending to call at the port.
This rolling average is based on the last 7 days of data and is updated daily in seaexplorer. To find the latest waiting time for a port, enter the port name or code in the search bar and select the relevant option.
Stay Ahead, Stay Informed: Register for seaexplorer for the latest disruptions and vessel waiting times at global container ports.