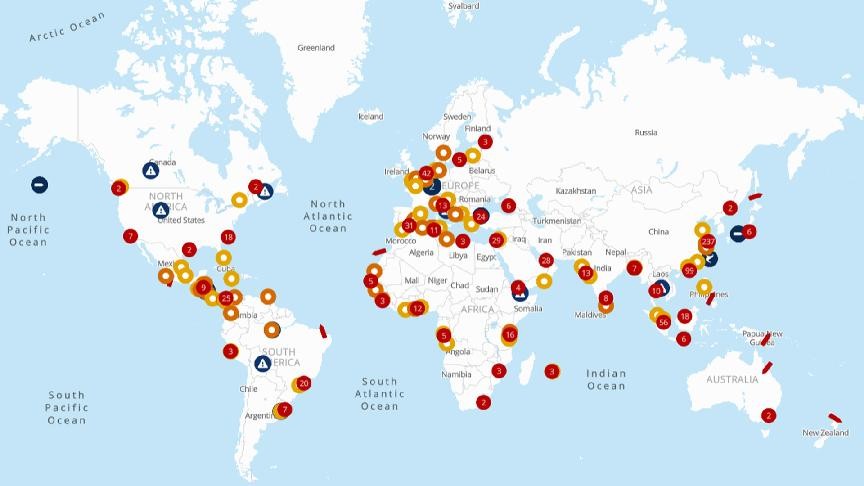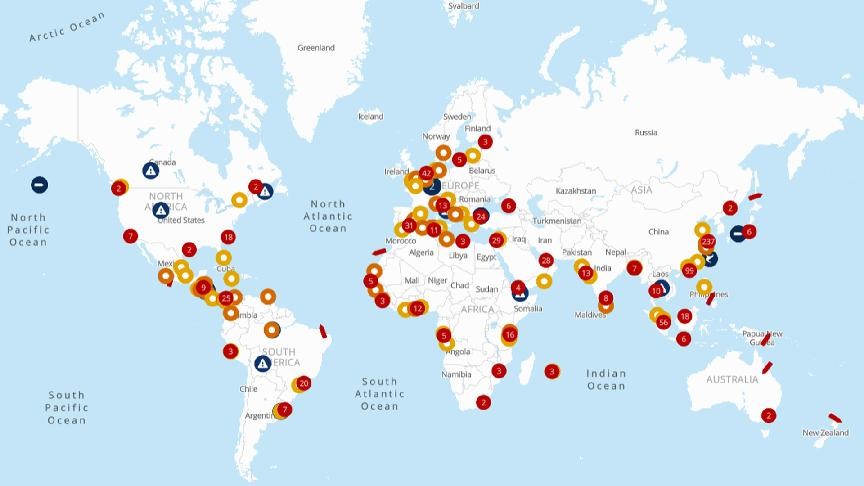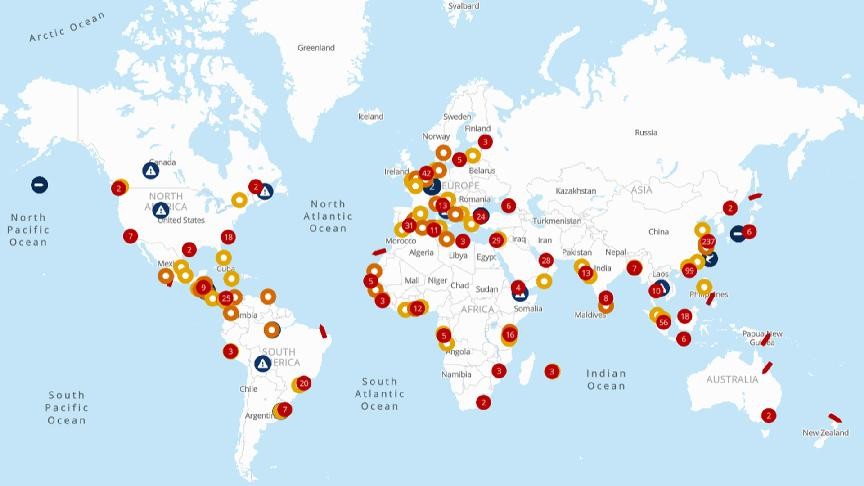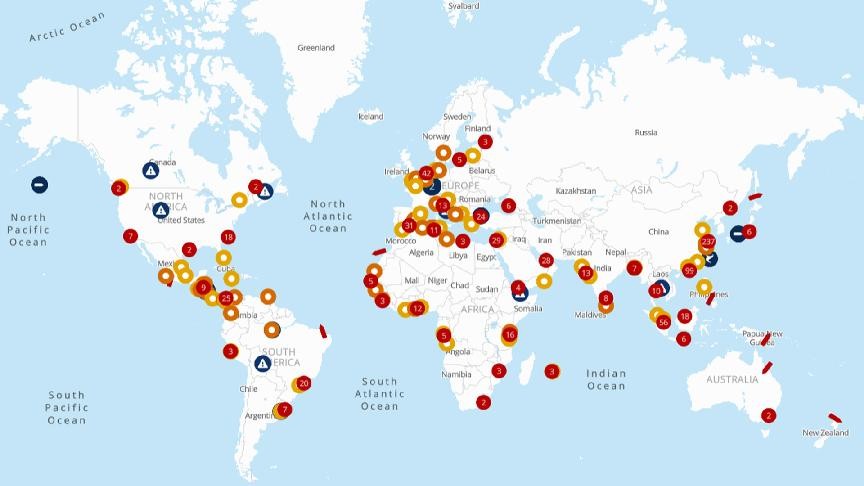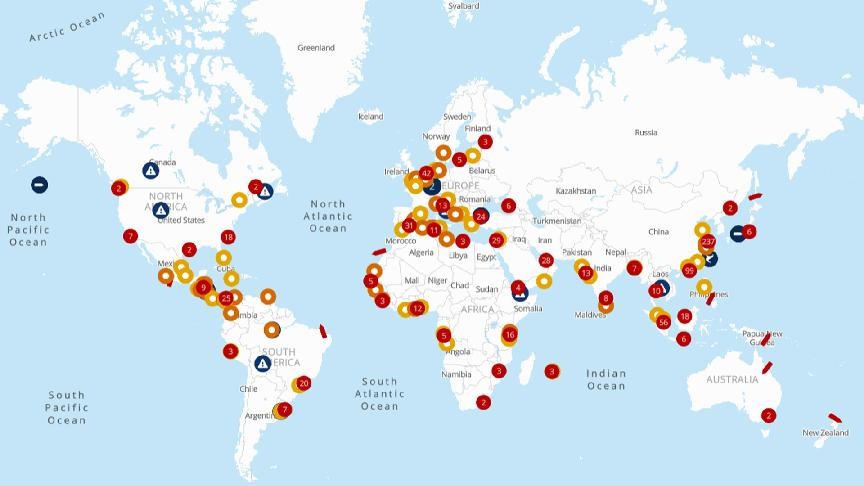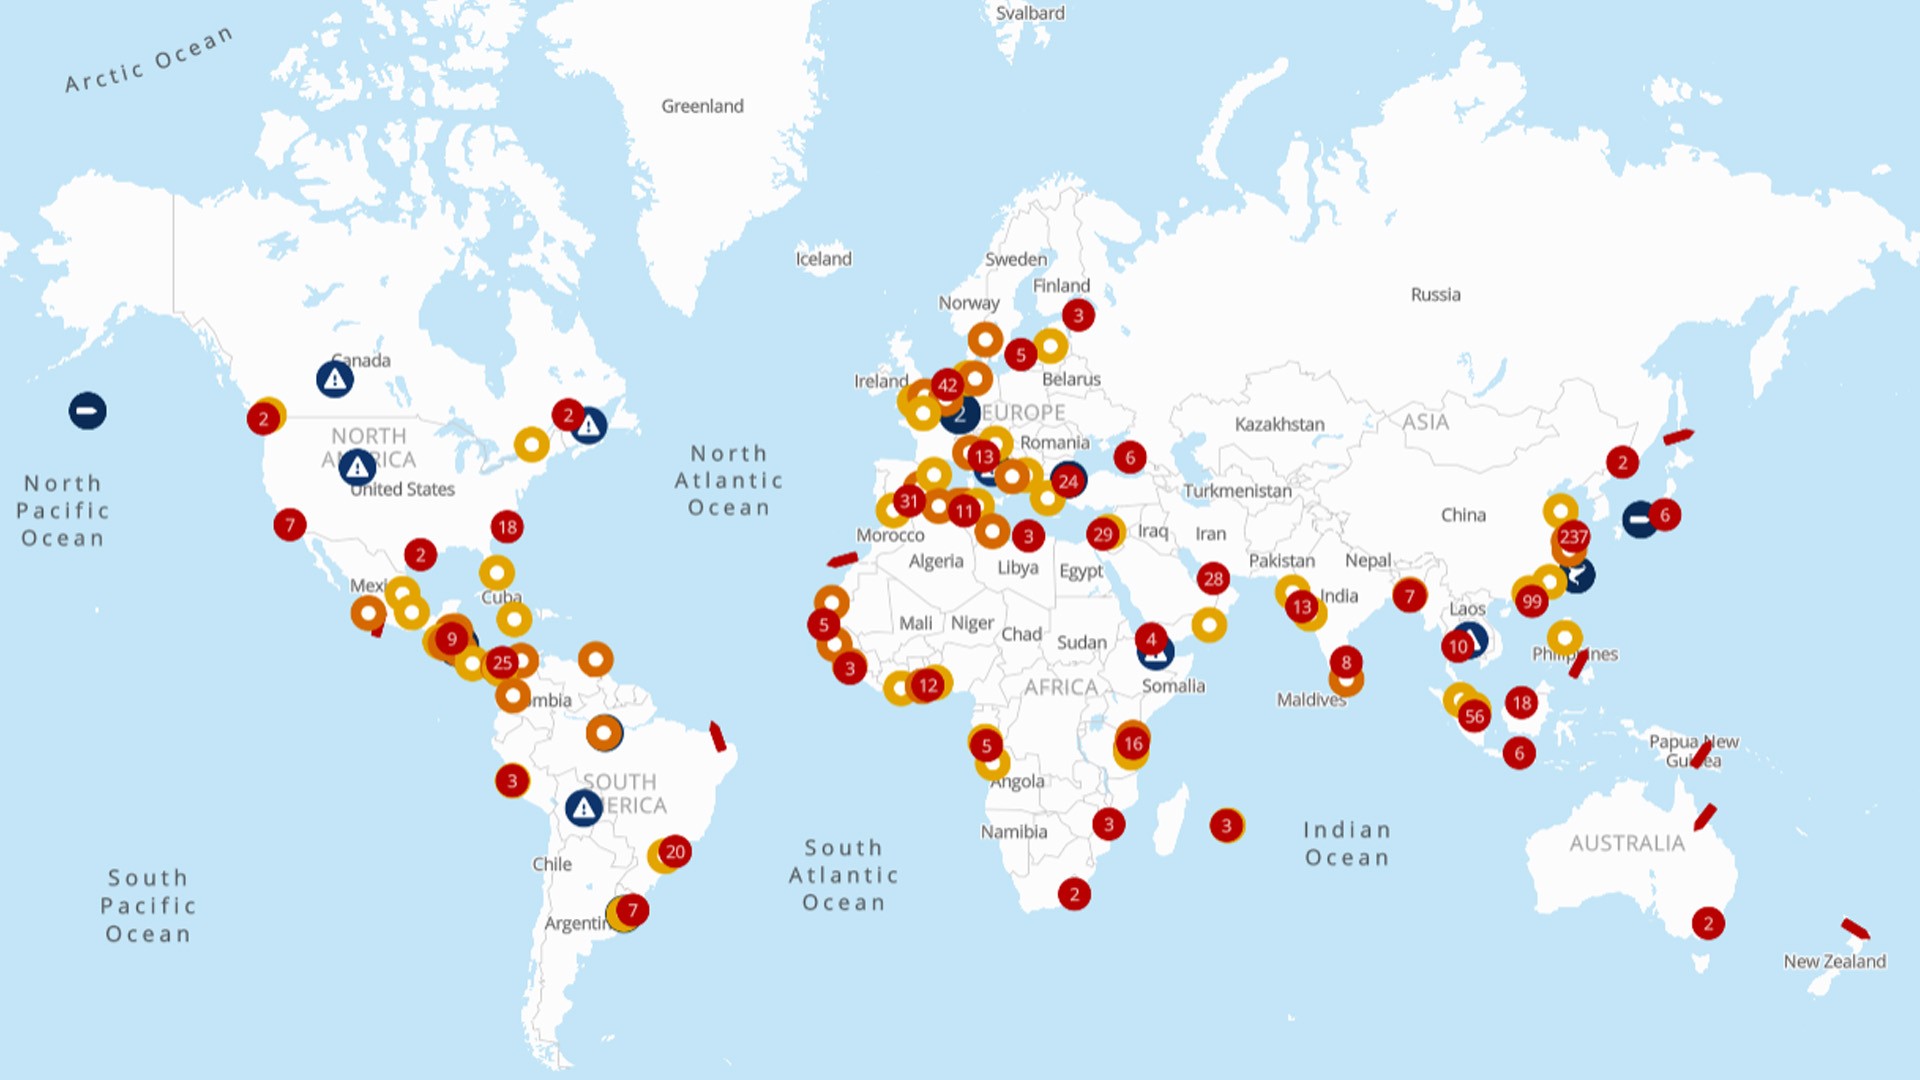

Stay ahead of supply chain disruptions and port congestion with Kuehne+Nagel’s weekly port operational update.
- Find out the latest vessel waiting times and status of ports in Africa, Asia, Oceania, Europe, the Middle East-Indian Subcontinent, North America, and South and Central America.
Africa
Ghana
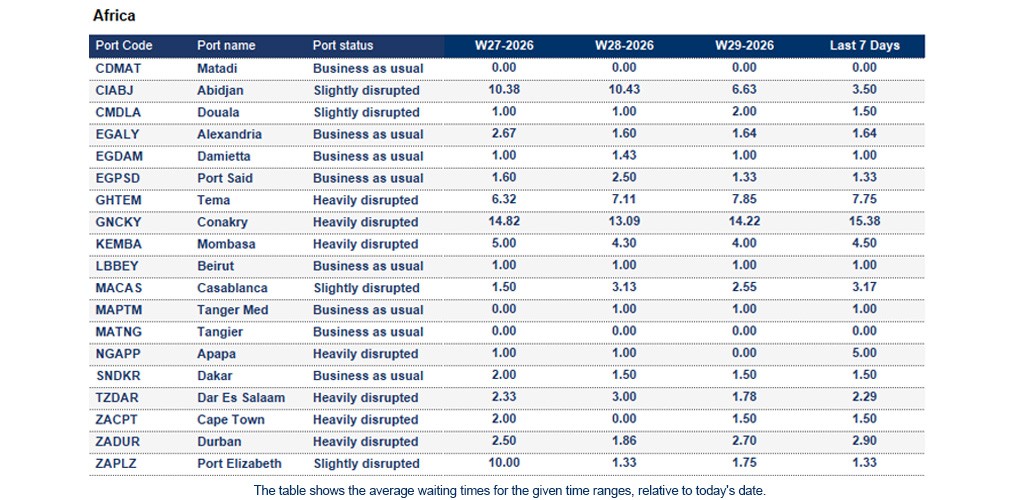
Tema: The 7-day average vessel waiting time is around 7.75 days. Heavy rainfall and flooding, which peaked on 28–29 June, continue to affect transport corridors and truck access to the port. Supply chain risks remain moderate to high during the rainy season, with potential power outages and road congestion likely to cause further logistics disruptions.
Ivory Coast
Abidjan: The 7-day average vessel waiting time is around 3.5 days. Port congestion remains high due to strong regional trade volumes, vessel bunching, intermittent power outages, and infrastructure constraints. As the main gateway for Mali, Burkina Faso, and Niger, heavy import and transhipment demand continues to place pressure on container yards, port gates, and surrounding road networks. Some carriers have implemented congestion surcharges, while the rainy season is expected to further impact inland cargo evacuations.
Kenya
Mombasa: The 7-day average vessel waiting time is around 4.5 days. Persistent congestion, vessel queues and high yard utilisation continue to impact this key East African gateway. Equipment imbalances, customs delays, flood-damaged roads and truck shortages are restricting throughput and inland cargo movements.
Mauritius
Port Louis: The 7-day average vessel waiting time is around 2.0 days. Increased vessel traffic due to route diversions and high transhipment volumes continues to place pressure on port facilities. While operations remain relatively stable, the sustained growth in throughput is increasing congestion risks and putting additional strain on existing infrastructure.
Mozambique
Beira: The 7-day average vessel waiting time is around 15.44 days. Terminal recovery is currently expected between Weeks 40 and 43. In the meantime, intermittent strong winds and rainfall are forecast throughout the week and may continue to affect operational efficiency and cargo movements.
Nigeria
Apapa: The 7-day average vessel waiting time is around 5.0 days. Road congestion around the port remains a key operational challenge. Supply chain disruptions continue to be driven by truck turnaround delays, inconsistent Customs and terminal dwell times, and peak-season surcharges, which are increasing overall logistics costs.
Asia Oceania
China
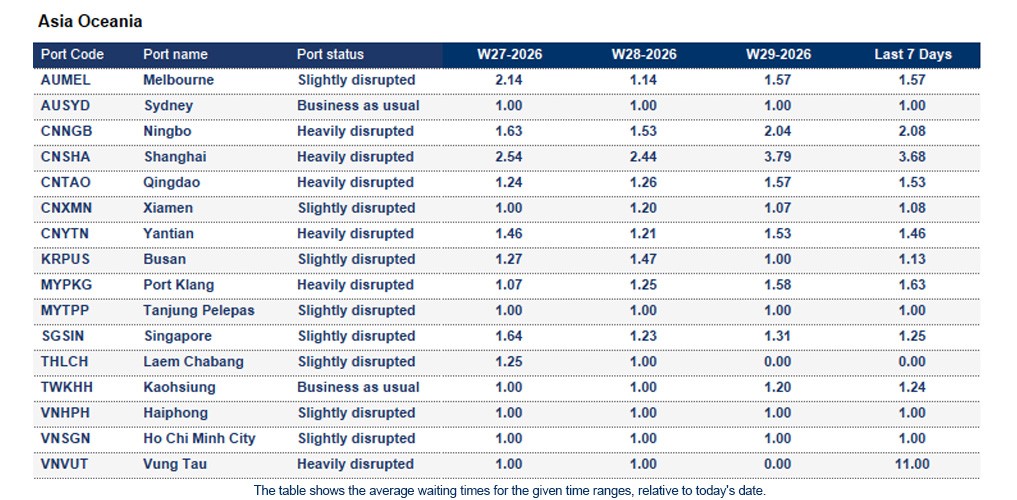
Port congestion remains elevated following Typhoon Bavi, with the most severe impacts seen in Shanghai and Ningbo. Shanghai continues to experience significant vessel delays and schedule disruptions after prolonged terminal closures, while Ningbo remains under pressure from vessel backlogs, high yard utilisation, and carrier schedule adjustments. Qingdao is gradually recovering from post-typhoon vessel bunching, with waiting times expected to improve next week. In Yantian, terminal capacity remains constrained due to quay crane upgrades and berth restrictions, with congestion risks expected to increase as additional vessel arrivals concentrate from North and Central China.
Indonesia
Semarang: The 7-day average vessel waiting time is around 1 day. Berth congestion remains high, with average vessel delays of around 2 days. Yard utilisation has increased to 82%, placing additional pressure on terminal operations and cargo flows.
Japan
Kobe: The 7-day average vessel waiting time is around 1.2 days. Waiting Time: 1.2 days.
Yokohama: The 7-day average vessel waiting time is around 1.2 days. Vessel waiting times remain at around 1.5 days due to cargo overflow from last week and continued heavy vessel bunching.
Malaysia
Port Klang: The 7-day average vessel waiting time is around 1.63 days. Yard density has increased to 90–95%, while heavy berth congestion is causing average vessel delays of 2–3 days. Additional vessel bunching by multiple carriers is expected this week and next. To help alleviate congestion, the planned maintenance dredging has been postponed to 3–12 August.
Philippines
Manila: The 7-day average vessel waiting time is around 4.48 days. Heavy berth congestion continues, with off-window vessels experiencing delays of more than 5 days. Regional schedule disruptions following Typhoon Bavi have further increased vessel bunching, with overall vessel delays in Manila reaching 10–12 days. Congestion is expected to persist as carriers work through backlogs and network disruptions.
Singapore
Singapore: The 7-day average vessel waiting time is around 1.25 days. The situation has stabilised, with overall terminal waiting times reduced to 0.5–1 day due to lower berth demand. However, yard utilisation remains relatively high at around 80%, requiring continued monitoring of terminal capacity.
Thailand
Laem Chabang: The 7-day average vessel waiting time is around 1 day. Operations remain generally stable; however, flooding risk remains elevated, and export infrastructure continues to face increasing exposure to climate-related disruptions that may affect cargo flows and supply chain reliability.
Europe
Belgium
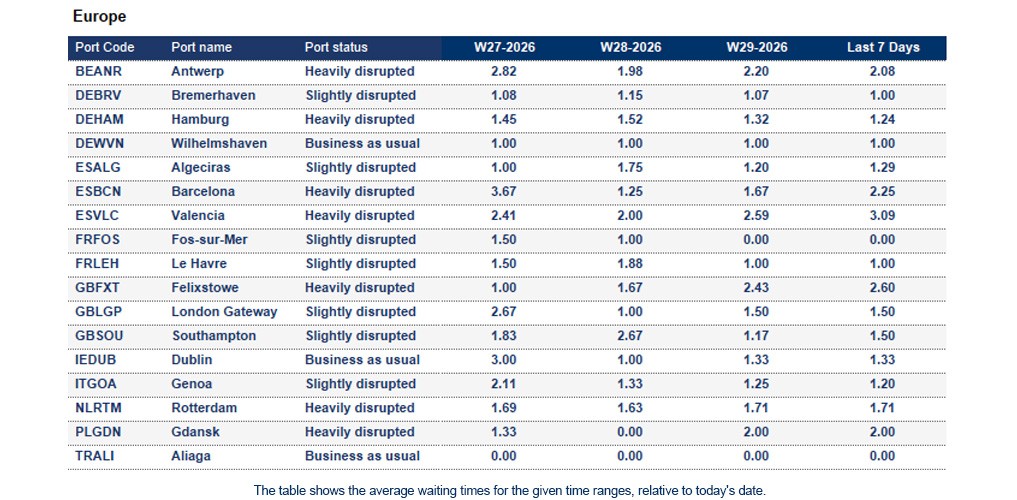
Antwerp: A toxic gas leak from a container on 14 July led to the suspension of terminal operations, evacuation of personnel, and temporary closure of shipping traffic in the affected area near Deurganck Dock. Cleanup and air-quality monitoring continued over the following days, while other terminals gradually resumed operations. As of 17 July, the MPET terminal was declared safe, vessel berthing and cargo operations resumed, and all port and vessel activities returned to normal. Read more here
France
Fos-sur-Mer: The 7-day average vessel waiting time is around 2.0 days. Wildfires in southern France are causing transport disruptions across the Marseille, Lyon, and Fos-sur-Mer areas. Road and rail movements may be affected, potentially impacting cargo flows, inland transport, and supply chain reliability in the region.
Germany
Bremerhaven: The 7-day average vessel waiting time is around 1 day. Yard occupancy is approaching 90%, with capacity becoming increasingly constrained, particularly for IMO and out-of-gauge (OOG) cargo. While the vessel lineup remains stable, the upcoming holiday period at NTB is expected to create additional operational pressures and may result in service disruptions.
Hamburg: The 7-day average vessel waiting time is around 1.24 days. Yard occupancy remains high. Inland transport challenges continue due to rail network capacity constraints and ongoing infrastructure modernisation projects. Several terminals are also reporting high yard utilisation for dangerous goods (DG) cargo, adding pressure to storage capacity and operational planning.
Italy
Genoa: The 7-day average vessel waiting time is around 1.2 days. High terminal congestion continues, driven by shipping schedule changes, trucking delays, berth pressure, rail capacity constraints, and seasonal driver shortages. These factors are impacting cargo flows and may result in ongoing operational delays.
Netherlands
Rotterdam: The 7-day average vessel waiting time is around 1.71 days. High yard density and ongoing inland barge congestion continue to impact operations. Periodic restrictions on the acceptance of empty containers remain in place, which may affect equipment availability and cargo flows.
Spain
Barcelona: The 7-day average vessel waiting time is around 2.25 days. Yard capacity remains under pressure due to seasonal volume increases and inland trucking constraints. Heatwave conditions and wildfire-related road closures are also affecting road transport, creating additional risks for cargo movements and supply chain reliability.
Middle East - Indian Subcontinent
Bangladesh
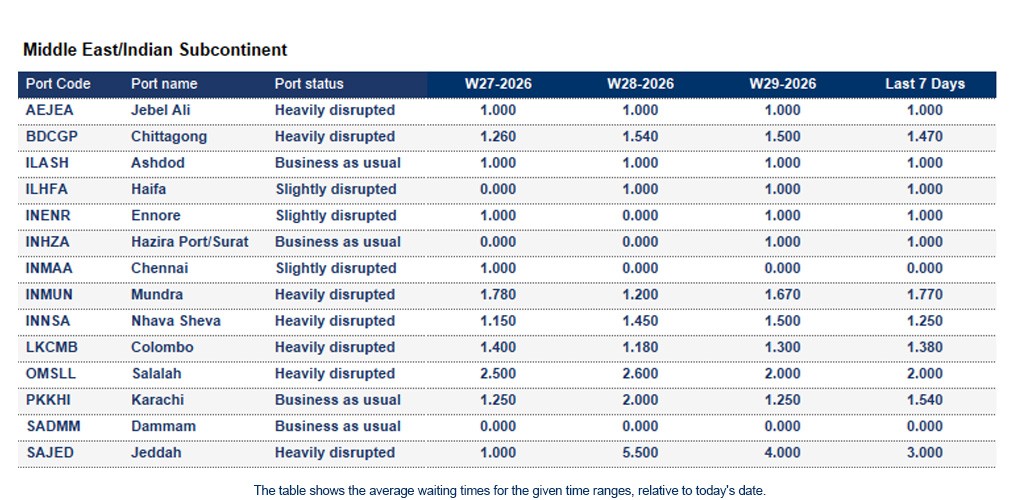
Chittagong (Chattogram): The 7-day average vessel waiting time is around 1.47 days. The previously announced 48-hour prime mover strike/lockout has now been withdrawn following successful discussions. As a result, all operational activities are expected to continue as normal. Read more.
India
Chennai: The 7-day average vessel waiting time is around 1 day. Capacity remains adequate; however, monsoon weather conditions and storm activity in the Bay of Bengal continue to pose operational risks and may cause intermittent disruptions to port and inland transport operations.
Mundra: The 7-day average vessel waiting time is around 1.77 days. The port remains vulnerable to monsoon-related weather disruptions, which may impact vessel schedules and cause intermittent delays to port operations and cargo movements.
Sri Lanka
Colombo: The 7-day average vessel waiting time is around 1.38 days. High congestion continues due to Middle East cargo diversions, with elevated yard occupancy and inter-terminal transfer delays impacting productivity. Some carriers have adjusted terminal allocations to help manage ongoing capacity constraints.
North America
Canada
Wildfires in Northern Ontario continue to disrupt rail operations, affecting intermodal freight movements between Brampton and Western Canada. Rail traffic between Sioux Lookout and Armstrong remains interrupted, with CN rerouting transcontinental freight trains and access restrictions still in place. No impacts to port operations have been reported, although rail-related cargo delays are expected to continue. Passenger rail services have also been affected, with cancellations on the Toronto–Winnipeg route. Read more here
Average import rail dwell time for Canadian cargo (Vessel arrival to departure rail ramp):
- Halifax: 3 days
- Montreal: 7 days
- Prince Rupert: 6 days
- Saint John: 5 days
- Vancouver: 4 days
Mexico
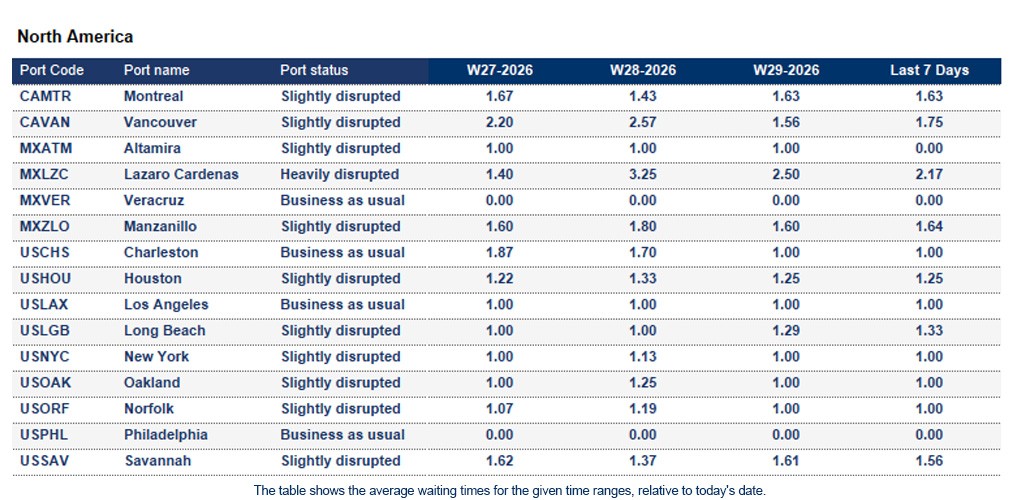
Altamira: The 7-day average vessel waiting time is around 1 day. Port operations are experiencing high congestion and notable delays, which continue to impact vessel schedules and cargo flows.
Manzanillo: The 7-day average vessel waiting time is around 1.64 days. Operations remain generally operational, but congestion risk remains elevated due to ongoing capacity and supply chain pressures.
United States
Average import rail dwell and transit time for US cargo (Vessel arrival to departure rail ramp):
- Halifax- 13 days
- Montreal- 7 days
- Prince Rupert- 7 days
- Vancouver- 6 days
- Saint-John- 7 days
- Charleston- 2 days
- Newark- 3 days
- Houston- 8 days
- Wilmington- 2 days
- Los Angeles- 5 days
- Long Beach- 6 days
- New York- 4 days
- Miami- 1 day
- Oakland- 6 days
- Norfolk- 2 days
- Philadelphia- 10 days
- Savannah- 2 days
- Seattle- 5 days
- Tacoma- 4 days
South and Central America
Chile
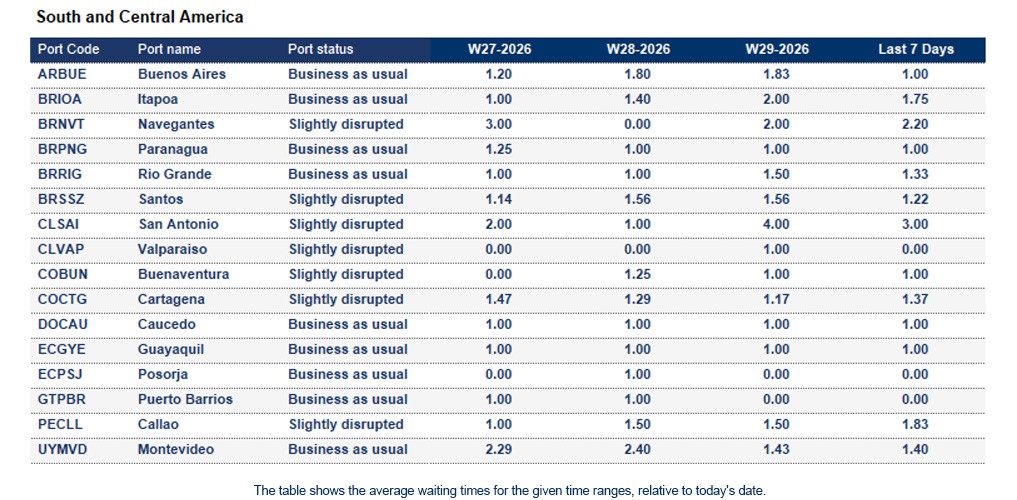
Operations continue across San Vicente, Coronel, Lirquén, San Antonio, and Valparaíso, with terminals remaining operational but experiencing varying degrees of vessel and cargo handling delays. Berthing windows and vessel calls continue to be rescheduled as ports work through backlogs following recent weather-related disruptions. Meanwhile, heavy swells, wind gusts of up to 80 km/h, thunderstorms, and heavy rainfall are expected to affect the Chilean coast in the coming days. No port closures have been announced, but delays are likely to persist due to backlog recovery, vessel delays, and omitted sailings. Read more.
How Kuehne+Nagel estimates port disruption statuses
Seaexplorer has four port statuses that are estimated based mainly on the 7-day average vessel waiting time. Other factors include yard congestion, labour strikes, natural disasters or intermodal disruptions. Slightly different rules are applied to major ports, or ports that are hubs in their region, as they are typically more efficient.
- Business as usual means the port is currently operating without any significant disruption.
- Slightly disrupted is used if the 7-day average vessel waiting time exceeds 2 days.
- Heavily disrupted if the 7-day average vessel waiting time exceeds 4 days.
- Port closure is used when the port suspends operations due to a major disruptive event.
How Kuehne+Nagel calculates the 7-day average vessel waiting time
Mainline container vessels may spend a certain number of days waiting at designated anchorage areas before their scheduled port call.
To calculate the 7-day average waiting time, we consider the waiting days of these vessels, excluding:
- Waiting times for feeder vessels,
- Idle ships without an announced next port,
- Slow steamers heading toward the anchorage, but not actively waiting within the designated area
- Vessels passing through the anchorage area without intending to call at the port.
This rolling average is based on the last 7 days of data and is updated daily in seaexplorer. To find the latest waiting time for a port, enter the port name or code in the search bar and select the relevant option.
Stay Ahead, Stay Informed: Register for seaexplorer for the latest disruptions and vessel waiting times at global container ports.