
10 July 2025 (Lloyd's List) - THE Panama Canal Authority (ACP) has sounded the all-clear on water levels for the remainder of this year and early 2026. There will be no repeat of the drought that slashed transits in 2023-2024.
“The Panama Canal is operating at full water capacity,” affirmed ACP administrator Ricaurte Vasquez. “We have remained at 50 ft draught throughout the dry season, and we will continue to have a relatively wet rainy season for the remainder of the year, in preparation for the next dry season in early 2026.”
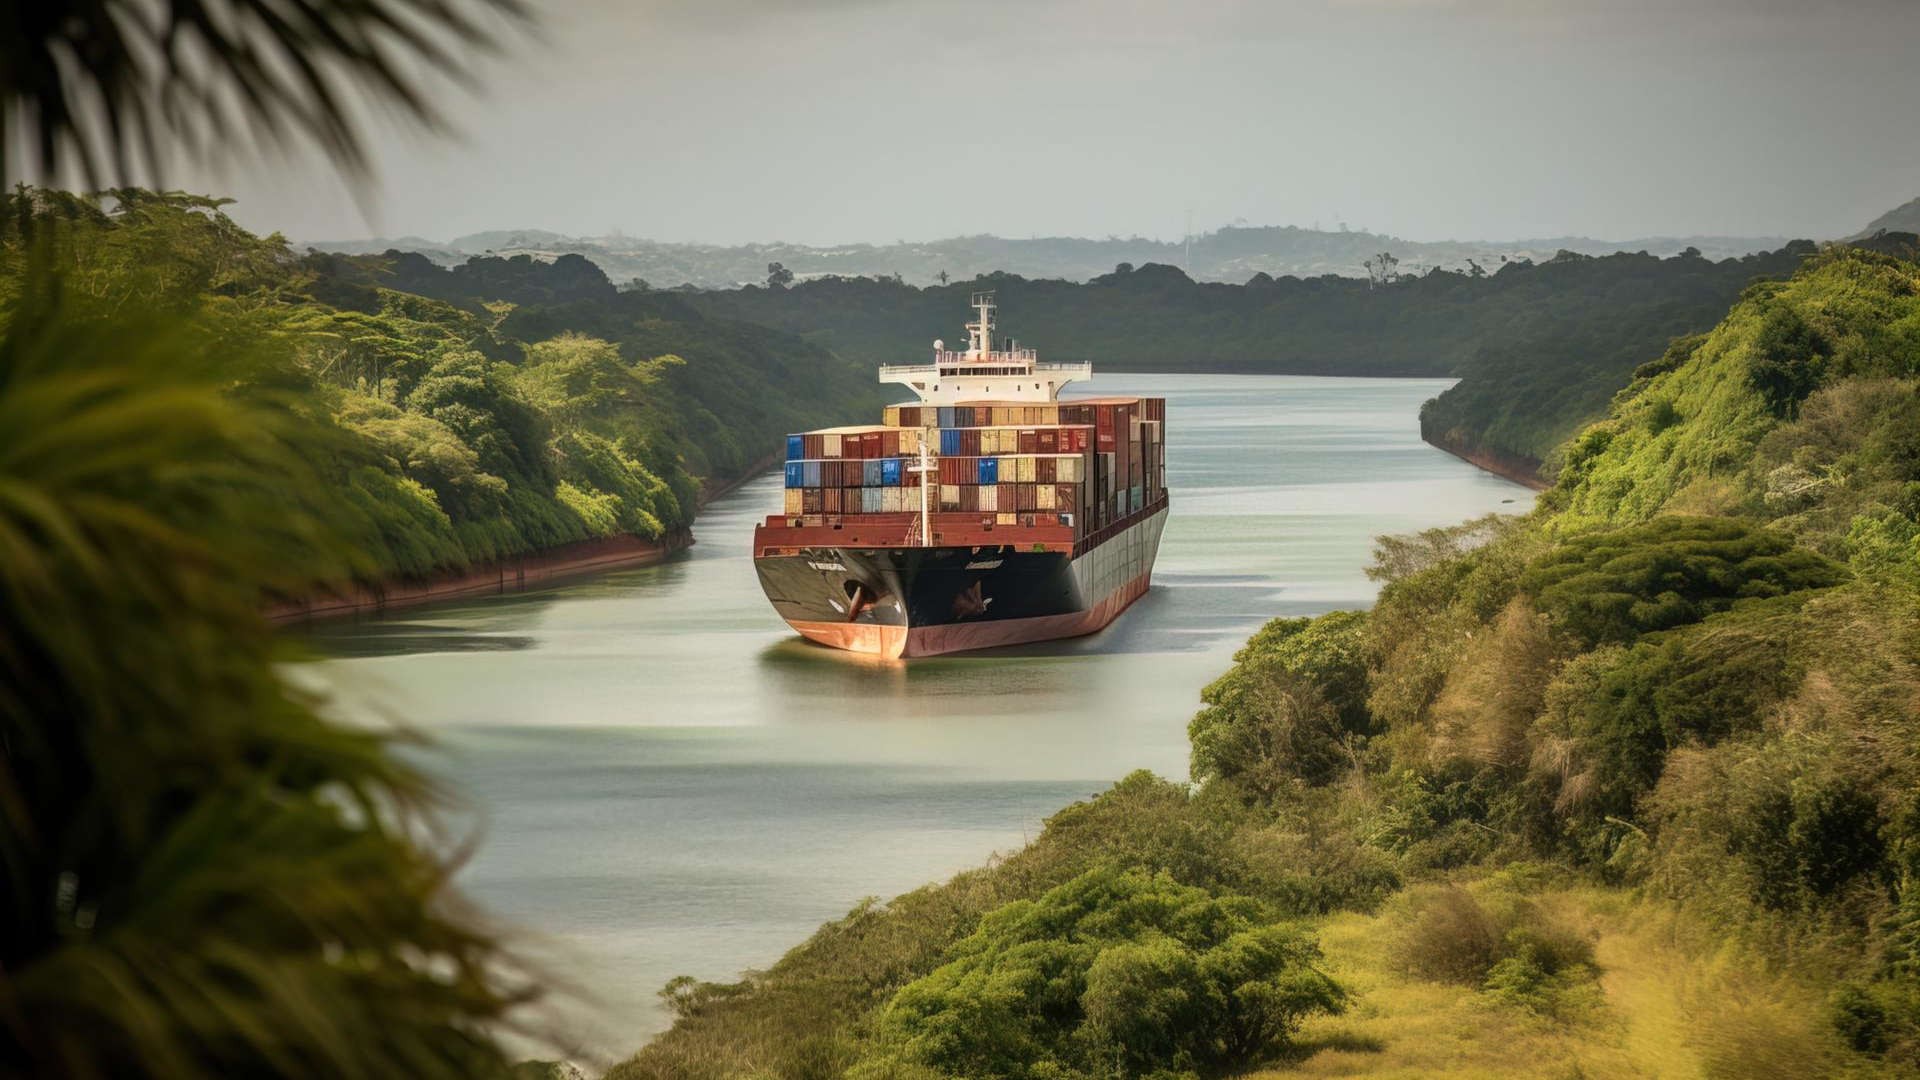
The Gatun Lake water level is currently at 86.6 ft (26.4 m), and has topped the 26 m level since last August.
Even so, data released this week by the ACP* shows that transits are not yet back to pre-drought levels.
There was an average of 31.4 transits per day in June versus 36 available daily slots. Last month’s average daily transits were flat month on month (m/m), but down 14% versus June 2022, prior to the drought, with neopanamax locks transits down 5% versus three years ago, and panamax locks transits down 16%.
Neopanamax locks
There were 252 transits through the neopanamax locks in June, down 8% m/m. An average of 8.4 vessels transited per day (versus 10 slots), down 5% m/m.
With the exception of February, it was the lowest number of monthly neopanamax transits since June 2024, when the waterway was still recovering from the drought.
The m/m decline was almost entirely driven by lower containership traffic, coinciding with disruptions to the Asia-US east coast trade due to US tariffs.
Neopanamax containerships transits fell 16% m/m, to 151, however, this was compared to the all-time record of 180 transits in May.
There were only five liquefied natural gas carrier transits in June, down one from May.
LNG shipping has not returned to the neopanamax locks following the drought. Prior to drought restrictions, there was an average of 26
LNG carrier transits per month. In 1H25, there was an average of just four per month.
LNG freight rates are off their historic lows, but they remain weak, making the longer route around the Cape of Good Hope more attractive.
Meanwhile, very large gas carrier transits through the neopanamax locks remained subdued in June, and are down significantly from peaks in late 2024 and early 2025, when monthly transits topped 100.
There were 71 VLGC transits last month, up 3% m/m. With the exception of this May, it was the lowest number of VLGC transits since May 2024, during the drought recovery period.
According to Jefferies analyst Omar Nokta, “VLGC spot rates remain elevated, at above $60,000 per day. Global averages are hovering at their highest levels since May 2024, when the Panama Canal disruptions had just begun to abate.”
Nokta noted that there was a period of “low spot rates during the second half of 2024 and first few months of 2025” coinciding with higher use of the neopanamax locks, which reduced tonne-miles for US Gulf-Asia voyages versus the Cape of Good Hope route.
Panamax locks
There were 689 transits via the panamax locks in June, down 2% m/m. An average of 23 vessels transited per day (versus 26 slots), up 2% m/m.
In the negative column, there were 16 fewer chemical tanker transits in June versus May (down 8%), six fewer ro-ros (down 9%) and six fewer containerships (down 8%).
Transits of smaller containerships have not rebounded since the drought. In general, container shipping has shifted toward the neopanamax locks.
June’s declines in boxships, ro-ros and chemical tankers were offset by gains from bulkers, traditionally the most important segment for the panamax locks.
There were 177 bulker transits through the panamax locks in June, up 23 transits or 15% m/m.
Panama Canal usage and dry bulk rates
“Dry bulk has recovered from last year,” said Vasquez. While that’s true, dry bulk transits via the canal have not returned to pre-drought levels.
Between October 2022 and June 2023, there were 2,088 bulker transits through both locks. Between October 2024 and June 2025, there were 1,633, a decline of 22%.
The primary driver of the drop: panamax-plus bulkers that used the neopanamax locks before the drought have not returned, as those slots are now overwhelmingly taken by containerships and VLGCs.
Neopanamax bulker transits over the past nine months are down 83% versus the same period in 2022-2023, whereas panamax bulker transits are down 12%.
Bulker transits haven’t recovered to pre-drought levels, but they were much higher — up 133% — in 1H25 versus 1H24, given drought fallout last year.
This has negatively affected sub-capesize spot rates, according to brokerage BRS. The use of the Panama route versus the Cape of Good Hope route for grain shipments from the US Gulf to Asia has cut tonne-miles.
“Lacklustre performance in 1H25 is [due to] a combination of various headwinds facing the dry bulk market, including a y/y improvement in Panama Canal laden transits,” said BRS.
“There has been a disproportionate decline in tonne-days growth relative to tonne growth despite vessel speed slowing down this year,” it explained. In the panamax segment, tonnes were down 2% in 1H25 versus 1H24, whereas tonne-days were down 8%.
“This means that laden distances of voyages on average — particularly for sub-capes — have shrunk massively.”
One reason for the shrinkage is higher Panama Canal transits, and the other is US-China trade tensions, said BRS. “US grains increased shipments to other, shorter-haul markets in Latin American and the Mediterranean as opposed to China.”
* The ACP does not release monthly transit statistics by segment or statistics on total monthly transits. It releases fiscal-year-to-date transits by segment and fiscal-year-to-date total transits since October, the beginning of its fiscal year. Lloyd’s List calculates monthly transits by comparing each month’s cumulative fiscal-year-to-date statistics.


