- As a leader in sea logistics, Kuehne+Nagel closely tracks and collects data on vessel movements, including actual arrivals and delays.
- Our 2026 reports focus solely on the direct services of the Top 12 carriers.
- A summary of this analysis, based on neutral data, is published monthly in our Schedule Reliability Report, available on Sea News.
Executive Summary
Global schedule reliability reached 47.1% in January 2026, marking a moderate month‑on‑month decline as most major trade lanes softened after the strong finish to 2025.
Average vessel delays increased: LATE vessels arrived 4.4 days behind schedule, while ALL vessels arrived 2.3 days late.
Several routes recorded double‑digit drops M/M, while only a few achieved modest gains, underscoring continued volatility across global networks.
Trade‑lane performance varied significantly. Asia↔North Europe recorded the lowest reliability at under 40%, followed closely by Asia↔ Mediterranean/Black Sea at 41.8%.
Several lanes, however, achieved double‑digit Y/Y improvements, with North America–focused corridors among the strongest recoveries.
Featured trade lane
North America East Coast ↔ North Europe ended January at 48.9%, a decline of nearly ten points after a strong December rebound, but still materially above its early‑2025 levels.
On the headhaul leg, reliability reached 46.0% in January 2026, outperforming previous years' results.
On a Y/Y basis, this direction made strong gains of 21 percentage points, reflecting a notable recovery in operational stability.
On the eastbound leg, reliability exceeded the global average in January, reaching 51.6% despite a drop of more than 15 percentage points.
Overall, January reflects a market adjusting after late‑year fluctuations but maintaining a generally positive year‑on‑year trajectory.
Global On-TimePerformance
Schedule reliability at the start of 2026 was 47.1%, closely matching the opening levels seen in the previous two years.
Nevertheless, this represents a decline of 6.7 percentage points compared to December 2025.
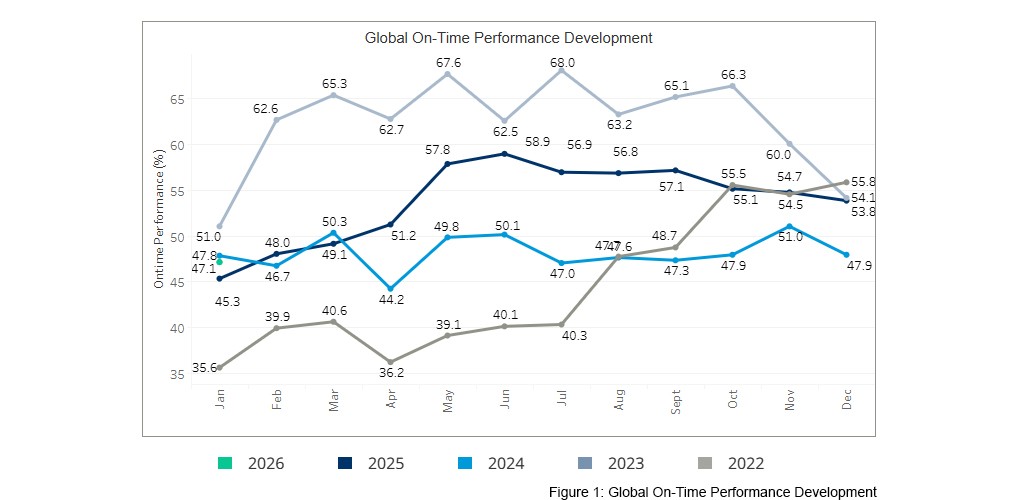
Although performance dipped M/M, it remains stronger Y/Y, with January 2026 coming in 1.8 percentage points above January 2025
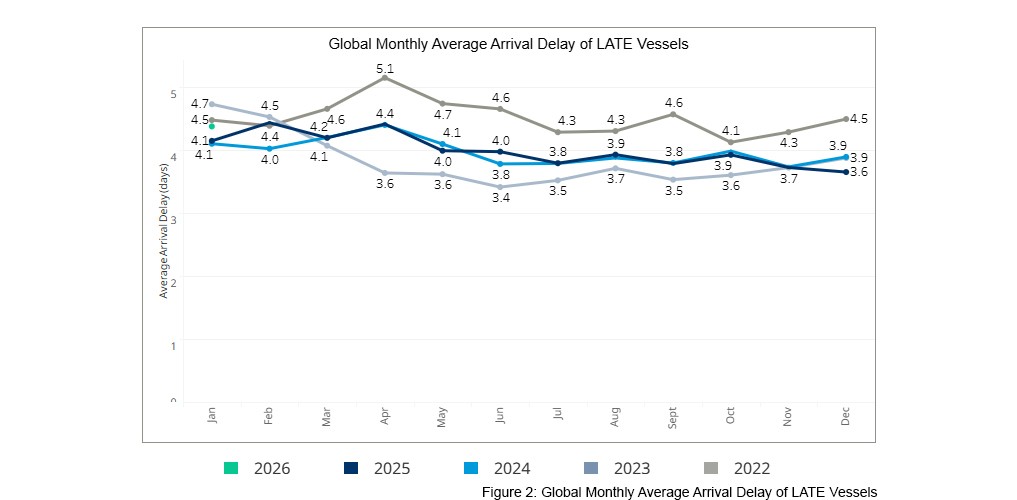
Average delays for LATE vessels increased by 0.8 days, reaching 4.4 days.
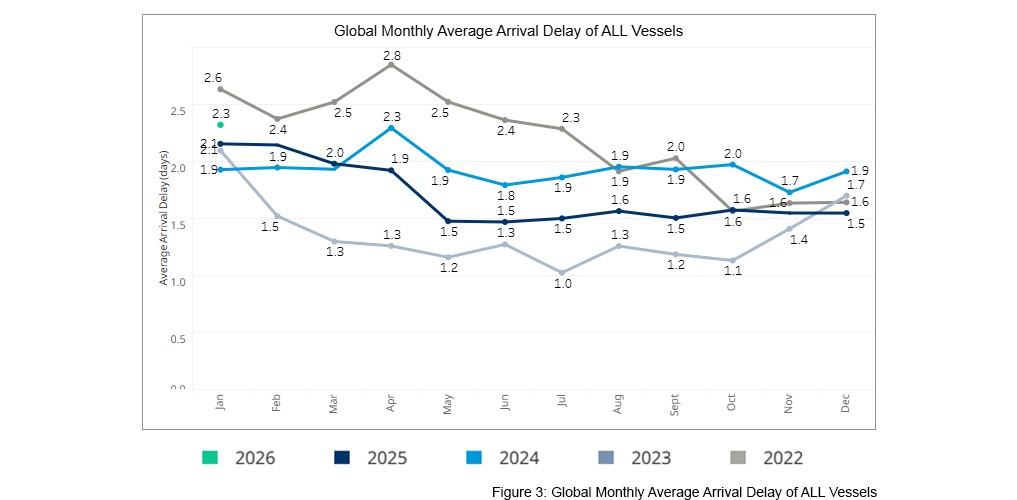
Delays across ALL vessels also rose, moving from 1.5 days in December to 2.3 days in January.
Reliability per TradeLane
Trade‑lane reliability softened broadly in January, with most routes posting month‑on-month declines and only a few showing modest gains.
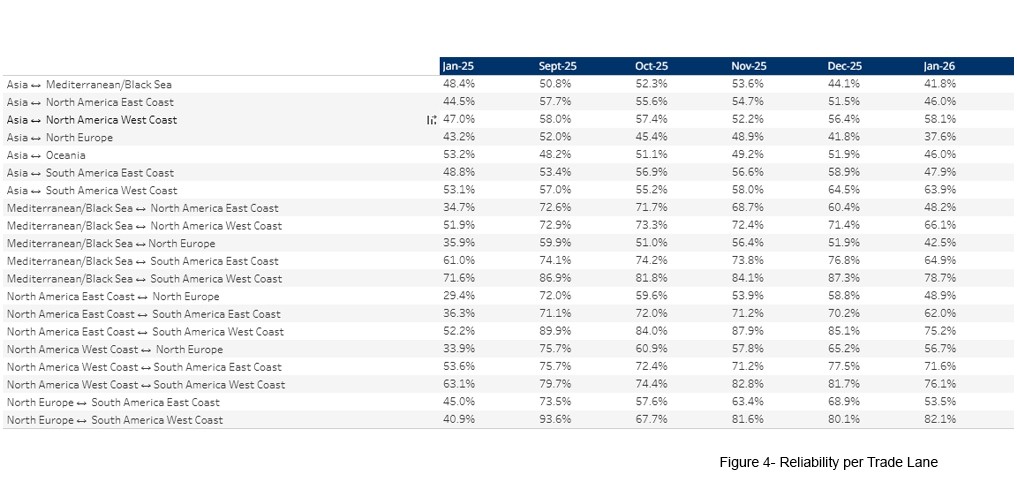
The largest M/M drops exceeded 10 percentage points, while the greatest improvements were in the low single digits.
Notably, reliability on Asia ↔ North Europe fell below 40%, making it the weakest‑performing corridor, followed closely by Asia ↔ Mediterranean/Black Sea at 41.8%.
Year over year, overall performance presents a more positive picture.
Several corridors achieved double‑digit Y/Y improvements, although a handful of trade lanes experienced moderate declines, resulting in a mixed but generally upward trend.
Reliability on North America East Coast ↔ North Europe
This month, we take a closer look at schedule reliability on the North America East Coast ↔ North Europe trade.
Reliability began the year at 29.4% in January 2025 and gradually recovered, reaching 58.8% in December.
However, last month the trade experienced a notable setback, declining by nearly 10 percentage points to 48.9%.In January,
LATE and ALL vessels were delayed by an average of 4.2 and 2.1 days, respectively.
Westbound
As shown below, reliability on this leg reached 46.0% in January 2026, surpassing previous years' results. This places the corridor just below the global average of 47.1%.
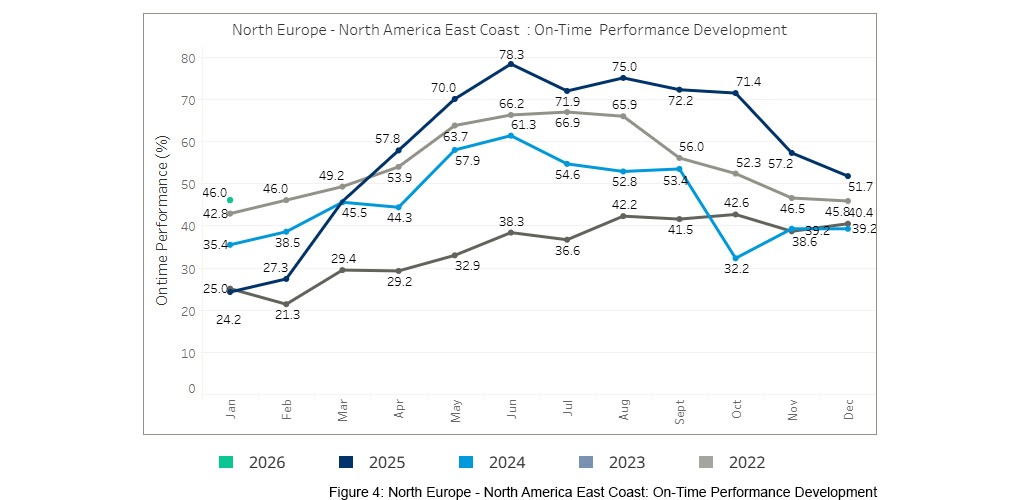
On a Y/Y basis, this trade lane delivered a strong improvement of 21 percentage points, reflecting a notable recovery in operational stability.
LATE vessels arrived on average 4.2 days behind schedule, while the average delay across ALL vessels was 2.1 days.
Eastbound
Reliability on this leg exceeded the global average in January, reaching 51.6%.
Following a sharp rebound in December, performance fell 15.6 percentage points month‑on‑month, marking a notable correction after last month’s surge.
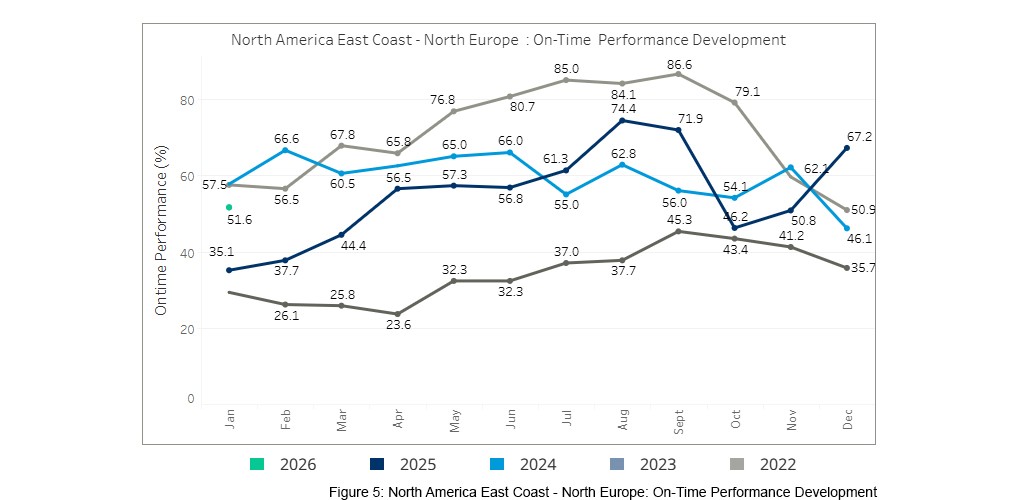
Operational delays also increased. The average delay for LATE vessels rose by one day to 4.3 days, while delays across ALL vessels doubled from 1.0 days in December to 2.1 days in January.
Despite this downturn, both figures remain broadly aligned with global patterns for the month.
Methodology
Calculating the on-time performance
To calculate the on-time performance of a service,Kuehne+Nagel uses vessel schedules from carrier(s) offering that service. Onlycarrier schedules that match our quality criteria are used for the schedulereliability calculation.
As carriers constantly update schedules, they become moreaccurate the closer vessels get to a destination port. For this reason, we haveimplemented a "schedule freeze period" of 14 days prior to actualvessel arrival. In other words, we benchmark the actual arrival with whatcarriers last announced 14 days earlier.
To identify the actual time ofarrival, Kuehne+Nagel consumes AIS (Automatic Identification System) vesseldata. All vessels that arrive within a +/- 24-hour window at the port of destination relative to the last announced arrival are considered ontime. Port call omissions and blank sailings announced after the 14-day freezeare excluded from the calculation.
This report focuses exclusively on the direct services of the top 12 carriers (MSC, Maersk, CMA CGM, COSCO, OOCL, Hapag-Lloyd, ONE, Evergreen, HMM, ZIM, Yang Ming, and PIL).
Assigning carrier services to multiple trade lanes
Many services operate on various trade lanes (e.g., a carrier service between Asia and North Europe also calls ports in the Middle East and/or the Mediterranean), and therefore, carrier services may be listed in multipletrade lanes.
Definition of trade lanes
There is no common standard for defining tradelanes. This means, depending on the source, you will find different trade lanes, as well as different regions, countries, and ports assigned to each trade lane.Kuehne+Nagel has defined its own mapping approach and assigned ports to thesetrade lanes accordingly. Vessel on-time performance is captured in our reports for defined main trades, i.e., trades that move large container volumeson vessels. Therefore, niche trades and services within one trade, called"Intra Trade" services (e.g. Intra-Asia, Intra-Europe), are currentlyout of scope.
A PDF version of this report can be found here.