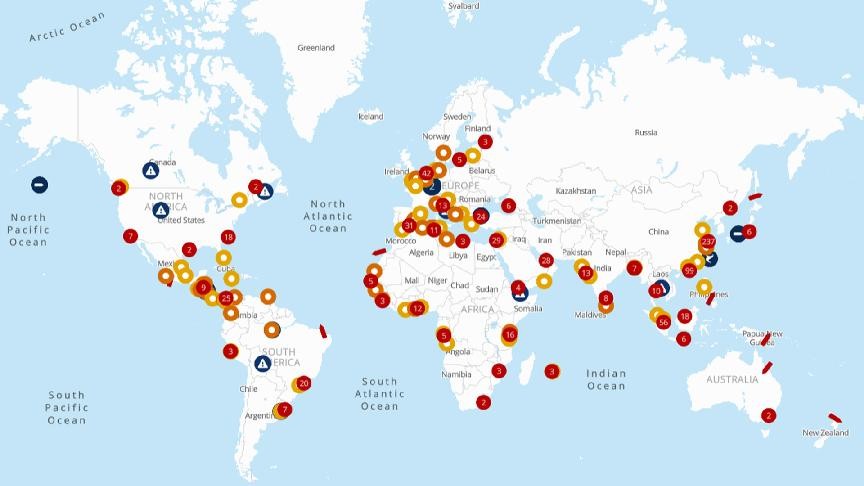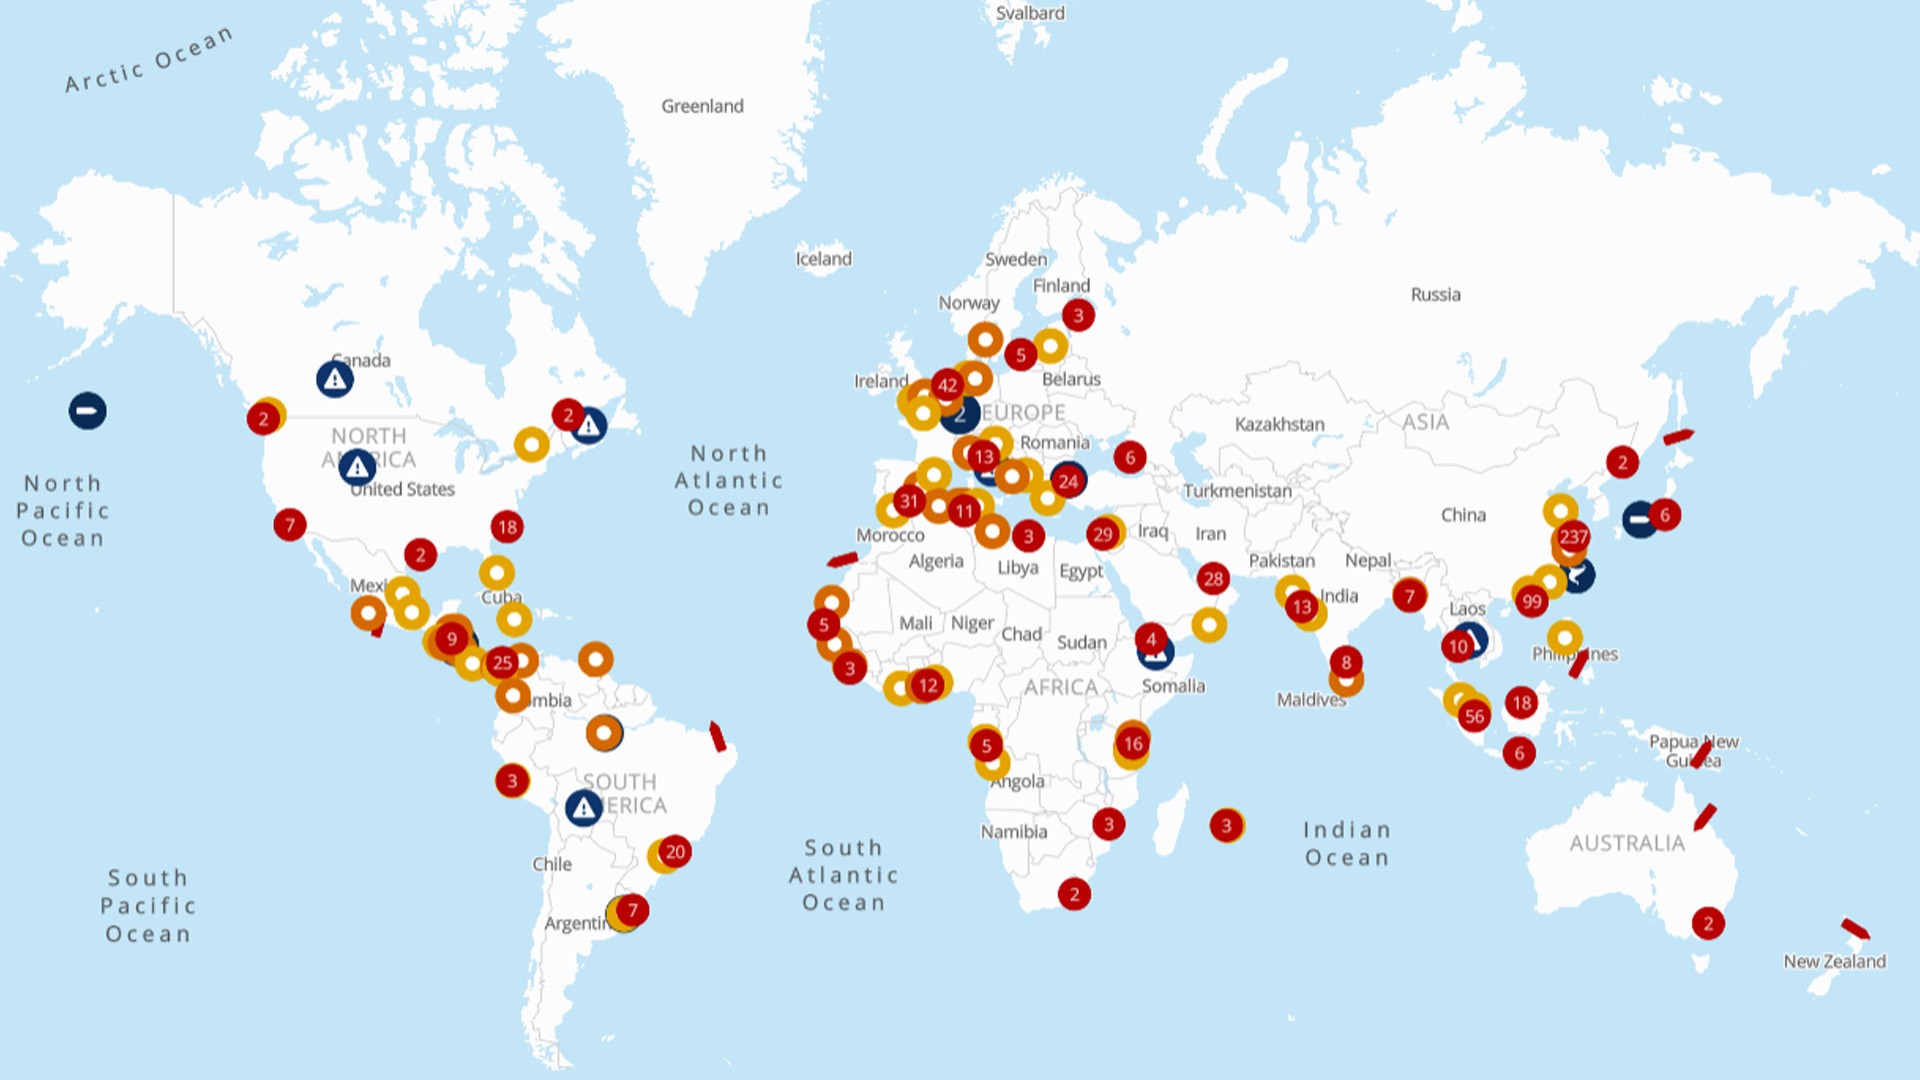

- Stay ahead of supply chain disruptions and port congestion with Kuehne+Nagel’s weekly port operational update.
- Find out the latest vessel waiting times and status of ports in Africa, Asia, Oceania, Europe, the Middle East-Indian Subcontinent, North America, and South and Central America.
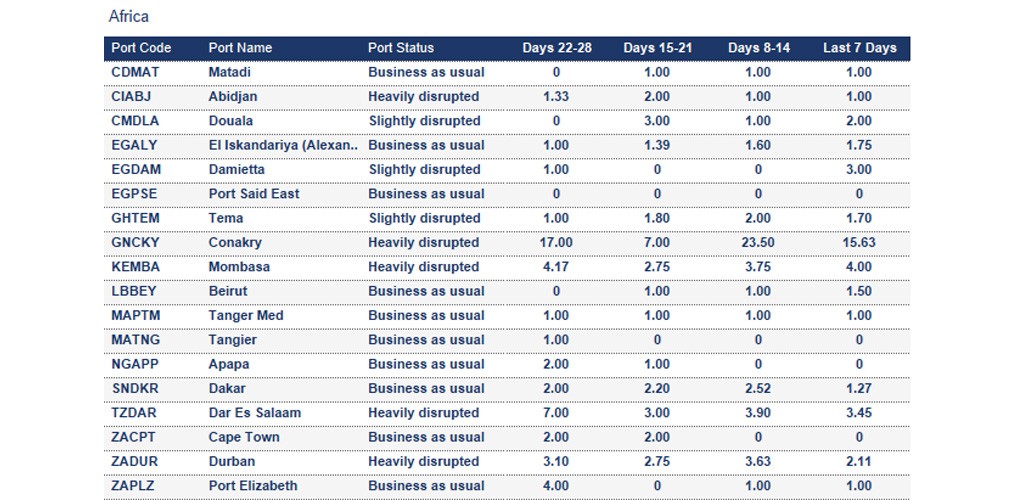
Africa
Ghana
Tema: The 7-day average vessel waiting time is 1.7 days. On-window vessels wait on average a day for a berth, while off-window arrivals wait up to 3 days.
Mali
Mali's supply chains are disrupted as fuel blockades hinder shipments and heighten security concerns. As a result, Kuehne+Nagel’s logistics operations were temporarily suspended amid escalating security risks. Read more.
Nigeria
Tincan/Lagos: Carriers report waiting times of up to 4 days.
Republic of the Congo
Pointe Noire: The 7-day average vessel waiting time is around 2.63 days.
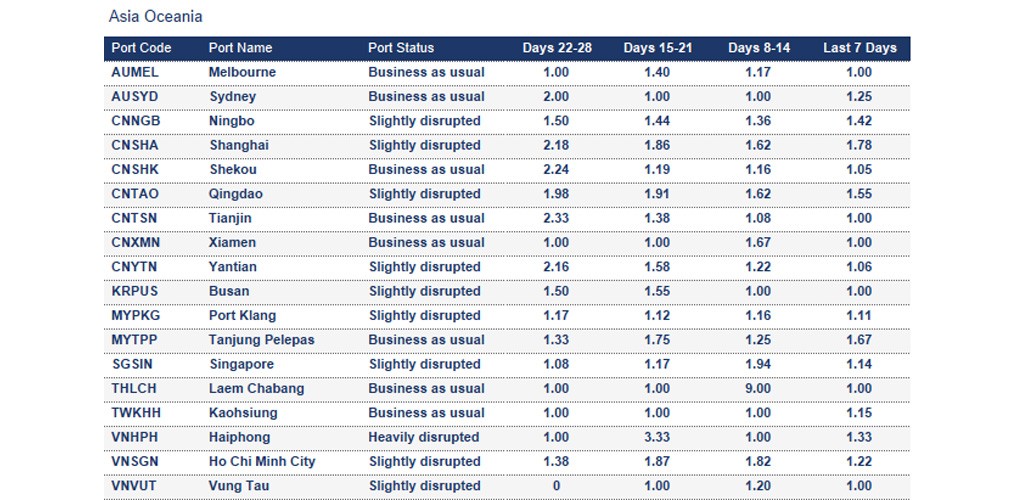
Asia Oceania
China
Dalian: The 7-day average vessel waiting time is around 3.75 days.
Ningbo: The 7-day average vessel waiting time is around 1.42 days due to berth and port congestion. At YZCT and CMICT terminals, maintenance dredging is currently underway, further complicating the operational situation.
Qingdao: The 7-day average waiting time is around 1.55 days due to port congestion, strong wind and rough sea and vessel bunching. Some carriers report waiting times of up to 3 days.
Europe
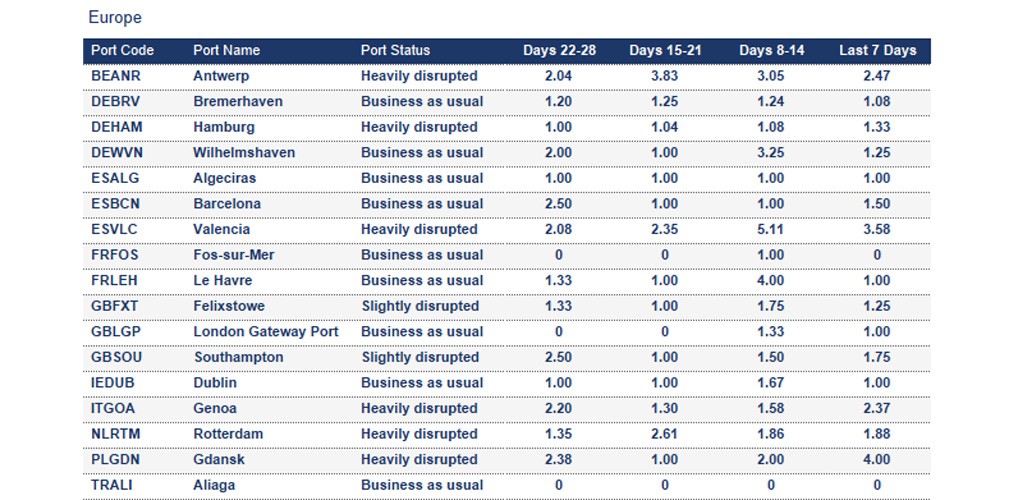
Belgium
Antwerp: The 7-day average vessel waiting time is around 2.47 days. The port is currently severely congested due to recent storm closures, labour shortages, and severe congestion of up to around 90% for dry and reefers, as well as crane reconstructions.
France
Le Havre (CNMP): Yard capacity is ~70% after diversions from Antwerp; 22–24 Oct storm brought high winds and gate operations were disrupted. A crane breakdown (708) is limiting deployment, likely extending port stays amid a heavy arrival program.
Marseille: The 7-day average vessel waiting time is around 2 days.
Germany
Hamburg: The 7-day average vessel waiting time is around 1.33 days. Port operations remain strained due to ongoing construction, adverse weather, and berth restrictions. Delays from RTM and ANR are impacting CTA availability, while Elbe river closures have pushed larger vessels into next week’s schedule.
- CTA: Construction has reduced mainliner berth capacity, requiring feeder vessels to be worked between strings. CTA’s long-term crane replacement program continues, with quay space reduced during construction. Shore power testing is ongoing. Operational challenges are expected to persist through year-end.
- CES has been temporarily rerouted to Unikai, where waiting times average 16.5 days. Yard density is high, dwell times are rising, and recent storms caused temporary shutdowns. Labour remains stable, and gate operations are normal. RWG services were suspended briefly due to high winds.
Bremerhaven (NTB): Yard capacity is ~85% and weather has slowed berthing/cargo operations slightly; some vessels have been re-sequenced to mitigate risk.
Hapag-Lloyd announced that as of 1 November 2025, NTB Bremerhaven will implement a revised gate policy whereby export containers arriving by road will only be accepted if the corresponding outbound vessel is scheduled to berth within the subsequent seven days. Containers linked to vessels with an estimated time of arrival beyond this window will be refused entry at the truck gate. This operational adjustment mirrors similar measures already enforced at key European ports, including Hamburg, Antwerp, and Rotterdam.
Greece
Piraeus: The port is currently congested, with an average 7-day vessel waiting time of around 5.51 days.
Netherlands
Rotterdam: The 7-day average vessel waiting time is around 1.88 days. The port was affected by severe winds during the week.
- ECT: Strong winds triggered around 12 hours of operational stoppages, pushing the line up; yard capacity is ~78%; barge/feeder delays ~24–48 hours.
- RWG: Yard capacity is ~80% near operational limits; feeder crane maintenance rerouted barges via
- MVII: Critical yard capacity this week is around 97%; to prevent box topples in high winds, the terminal reduced max berth capacity and stopped accepting MT deliveries by truck/barge.
- Delta II: Yard capacity is around 38% (reefers ~49%); winds limited berth capacity and cutting moves; an additional feeder was deployed to carry boxes to Hamburg.
Poland
Gdansk: The 7-day average vessel waiting time is around 4 days.
Romania
Constanta: The 7-day average vessel waiting time is around 2 days.
Slovenia
Koper: The 7-day average vessel waiting time is around 3.4 days. Container terminal utilisation is high. The cargo surge causes import and export dwell times of 5-6 days. Railway reconstruction until 3Q 2026 reduces train traffic, causing an increase in truck traffic.
Koper – rail corridor to Hungary: A fire incident occurred last week, causing trains toward Hungary to experience up to ~4 days delay.
Spain
Valencia: The 7-day average vessel waiting time increased to around 3.58 days due to the aftermath of the severe storm last week. The yard density is high.
Turkey
Izmit: The yard is around 80%.
United Kingdom
Felixstowe: The 7-day average vessel waiting time is around 1.25 days due to severe weather recently. Yard utilisation is currently high at 87%, with operations subject to cyclical fluctuations. Import dwell times remain low, whereas export dwell times are notably elevated.
Grangemouth: The yard is at 76%.
Southampton: The 7-day average vessel waiting time is around 1.75 days. Yard utilisation stands at 80% for dry containers and 60% for reefers. The schedule remains congested due to vessels arriving out of window.
Middle East - Indian Subcontinent
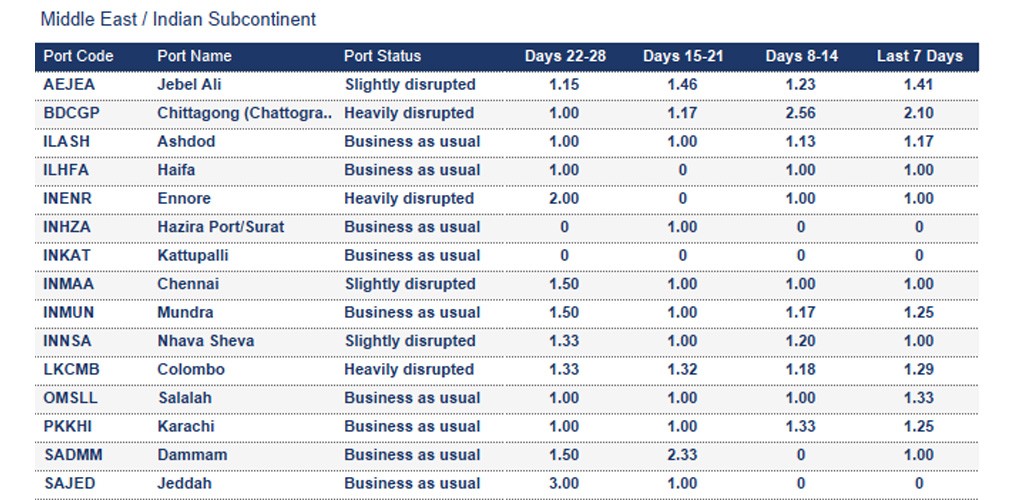
India
Cyclone Montha has intensified over the southwest Bay of Bengal this week, bringing torrential rain and winds up to 120 km/h for multiple states. The ports in the affected regions include Chennai, Ennore, Krishnapatnam and Visakhapatnam. Read more.
Sri Lanka
Colombo: Terminal operations have been adversely affected due to high yard congestion, increased transhipment volumes, and unfavourable weather conditions.
United Arab Emirates
Jebel Ali: Productivity is currently being impacted due to operational delays arising from crane malfunctions.
Yemen
Aden: The 7-day average vessel waiting time is around 4.5 days.
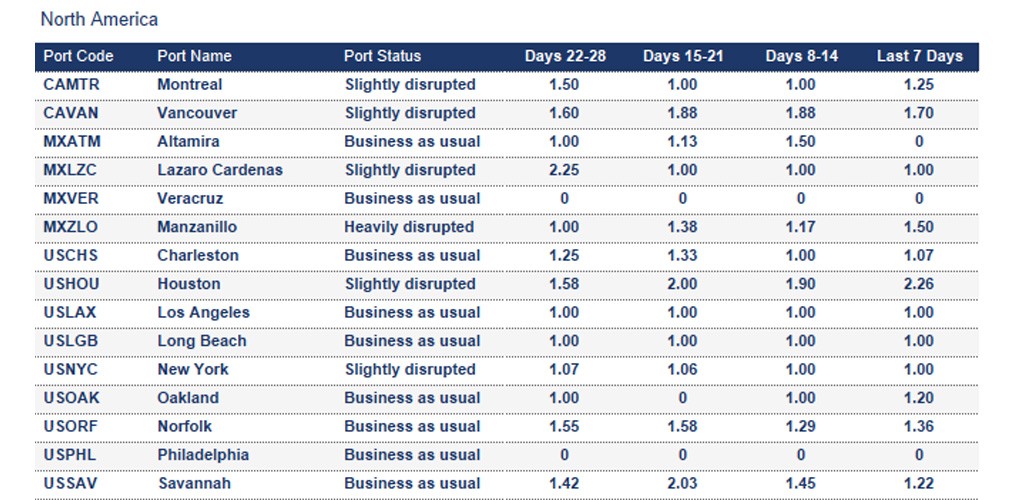
North America
Canada
Average import rail dwell time for Canadian cargo (Vessel arrival to departure rail ramp):
- Halifax: 4 days
- Montreal: 8 days
- Prince Rupert: 7 days
- Saint John: 5 days
- Vancouver: 8 days
Montreal: The 7-day average vessel waiting time is around 1.25 days. The average rail dwell time is around 8 days. The yard is at around 71% while vessel productivity remains high.
Prince Rupert: The 7-day average vessel waiting time is around 2 days. The average rail dwell time for Canadian cargo is 7 days.
Vancouver: The 7-day average vessel waiting time is around 1.7 days. The average rail dwell time is around 8 days. Container yard is at around 77%.
Mexico
Manzanillo: The 7-day average vessel waiting time is around 1.5 days. Recent developments in Mexico have led to widespread logistical disruptions, notably at Manzanillo port. Blockades and system outages are impacting truck and rail operations, causing delays and reduced efficiency. Processing times have increased, though some improvements in rail cargo handling are noted. Local operators anticipate continued challenges in affected regions. Read more.
Veracruz: Adverse weather is forcing regulated manoeuvres, with appointment slots delayed by ~1–2 days; heavy rain is also slowing road approaches, extending transit times.
Altamira: Operating with permitted entry, but heavy rains are slowing manoeuvres and impacting some warehouses, risking downstream delays; forward planning recommended.
Ensenada: Elevated demand is lengthening processing times at terminal/facilities; current port entry estimate ~40–60 minutes; plan operations in advance to minimise disruption.
United States
Average import rail dwell and transit time for US cargo (Vessel arrival to departure rail ramp):
- Montreal: 6 days
- Prince Rupert: 6 days
- Vancouver: 8 days
- Charleston: 2 days
- Houston: 9 days
- Los Angeles: 5 days
- Long Beach: 4 days
- New York: 4 days
- Norfolk: 2 days
- Savannah: 1 day
South and Central America
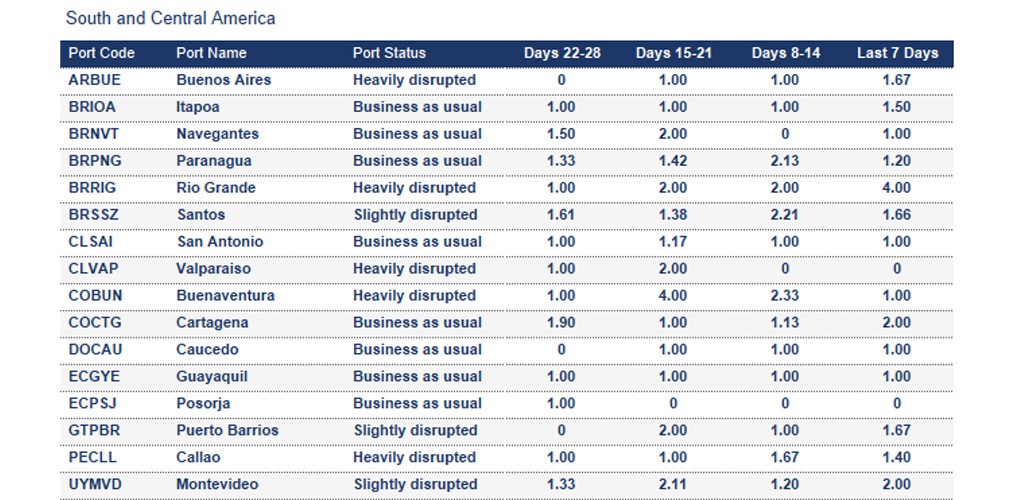
Brazil
Rio Grande: The 7-day average vessel waiting time is around 4 days.
El Salvador
Acajutla: The 7-day average vessel time is around 2.67 days.
Haiti and Jamaica
Port Au Prince and Port Kingston: ports are currently severely impacted by Hurricane Melissa. Read more.
Nicaragua
Corinto: The 7-day average vessel waiting time is around 1.75 days. The yard density is high. Vessels can wait up to 10 days before operations begin at the port.
How Kuehne+Nagel estimates port disruption statuses
Seaexplorer has four port statuses that are estimated based mainly on the 7-day average vessel waiting time. Other factors include yard congestion, labour strikes, natural disasters or intermodal disruptions. Slightly different rules are applied to major ports, or ports that are hubs in their region, as they are typically more efficient.
- Business as usual means the port is currently operating without any significant disruption;
- Slightly disrupted is used if the 7-day average vessel waiting time exceeds 2 days;
- Heavily disrupted is used if the 7-day average vessel waiting time exceeds 4 days; and
- Port closed is used when the port suspends operations due to a major disruptive event.
How Kuehne+Nagel calculates the 7-day average vessel waiting time
Mainline container vessels may spend a certain number of days waiting at designated anchorage areas before their scheduled port call.
To calculate the 7-day average waiting time, we consider the waiting days of these vessels, excluding:
- Waiting times for feeder vessels,
- Idle ships without an announced next port,
- Slow steamers heading toward the anchorage but not actively waiting within the designated area
- Vessels passing through the anchorage area without intending to call at the port.
This rolling average is based on the data from the last seven days and is updated daily in seaexplorer.
To find the latest waiting time for a port, enter the port name or code in the search bar and select the relevant option.
Stay Ahead Stay Informed: Register for seaexplorer for the latest disruptions and vessel waiting times at global container ports.