
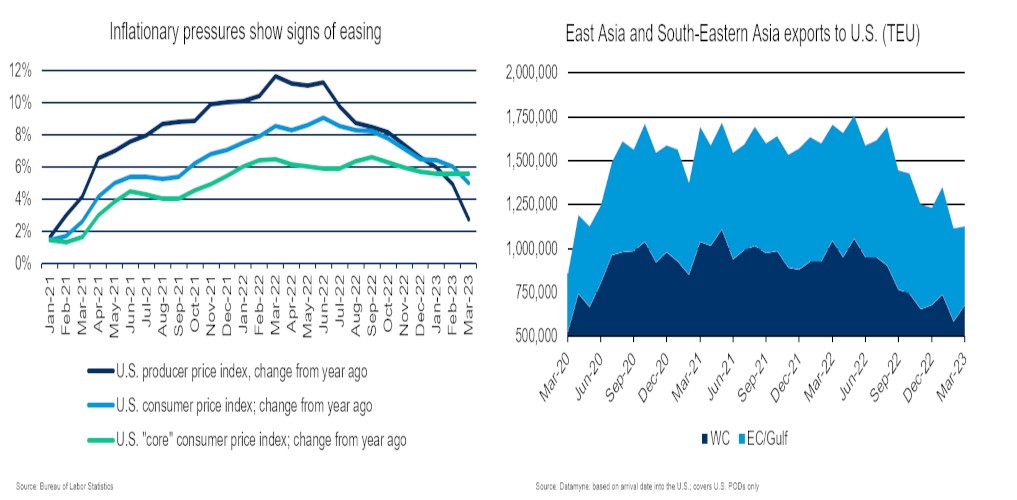
Inflationary pressure eases
According to March's Consumer Price Index (CPI), the Federal Reserve’s preferred measure for inflation, household costs rose at the slowest pace in 23 months. The so-called "core" CPI, which excludes volatile energy and food costs, was slightly up on an annualized basis.
While the CPI is generally seen as a lagging indicator, the Producer Price Index (PPI) tends to lead because it shows what suppliers can charge for goods, thus serving as a proxy for pricing power. For March, the PPI fell more than any other month in almost three years. While this may be a good sign for manufacturers and consumers, the fall in the PPI is a double-edged sword, signalling lower demand instead of increased supply.
"We expect the bite from the Fed's previous rate hikes will further reduce business and consumer demand, pushing producer price inflation lower throughout the rest of the year." - Matthew Martin, U.S. economist at Oxford Economics
Despite the slow-down in inflation, it remains well above the Federal Reserve's 2% target. Any further action from the central bank is expected to be at a more moderated pace since economists insist on a delicate balance to avoid a recession.
"The inflation problem doesn't get solved by itself—it needs higher unemployment to get there." - Steve Blitz, chief U.S. economist at TS Lombard
On the U.S. macro side, the labour market continues to cool. Unemployment remains at a multi-decade low of 3.5%.
Payroll growth in March was nearly double the historical average – at more than 236,000 jobs - this is far less than January's 472,000 and February's 326,000, reported the Department of Labour. Once again, according to the Labor Department, claims for unemployment insurance have been revised higher than the previous month’s estimates, and the number of job vacancies has also fallen significantly.
This, coupled with the Federal Reserve's opinion that higher unemployment is required to tame inflation, means clouds loom for the next few quarters.
Transpacific Eastbound Trade
Trade data shows a similar pattern to macroeconomic data, i.e. mixed messages.
But a few headline numbers first: cargo arriving at U.S. ports increased 1.1% in March compared to February. West Coast ports showed 16.3% growth, and East Coast ports fell by 15.9%. For Q1, volume is down 8.1% compared to Q4 and a staggering 27.4% compared to Q1 2022.
That said, ocean carriers and other market participants are seeing more cargo leave Asia in April. The expectation is volume will trend upward over the next few months as restocking of inventories finally hits the Transpacific Eastbound trade.
Courtesy of our Kuehne+Nagel colleague William Hazlegrove, Sea Logistics Trade Lane Manager- Transpacific Eastbound